Charts and data that didn’t fit in the weekly recaps, by week.
Week 7
These are the charts from the midseason analysis that didn’t make it into the Commissioner’s Notes in the 2026 Week 7 Recap. Everything here covers weeks 1–7.
How to read these
“Points” always means a team’s game margin, the same as scoring. A few measures show up throughout:
- Times played: how many lineup slots you started that team in.
- Points when active: the team’s total margin in the games you started it.
- Net points, owned: the team’s total margin in every game it played while on your roster, started or not.
- Net points, season: the team’s total margin in every game it has played this season, no matter who owned it.
- Pick edge: points when active minus (times played × the team’s season average margin). Positive means you started that team in its better-than-usual weeks.
In the team charts, each dot is one team on one player’s roster. Blue means drafted, orange means picked up as a free agent. A team that was drafted, dropped, and picked up again shows up twice, once for each stint. Integer counts like times played are jittered slightly so dots that would overlap stay visible.
Did you start the right teams?
Net points owned vs. points when active
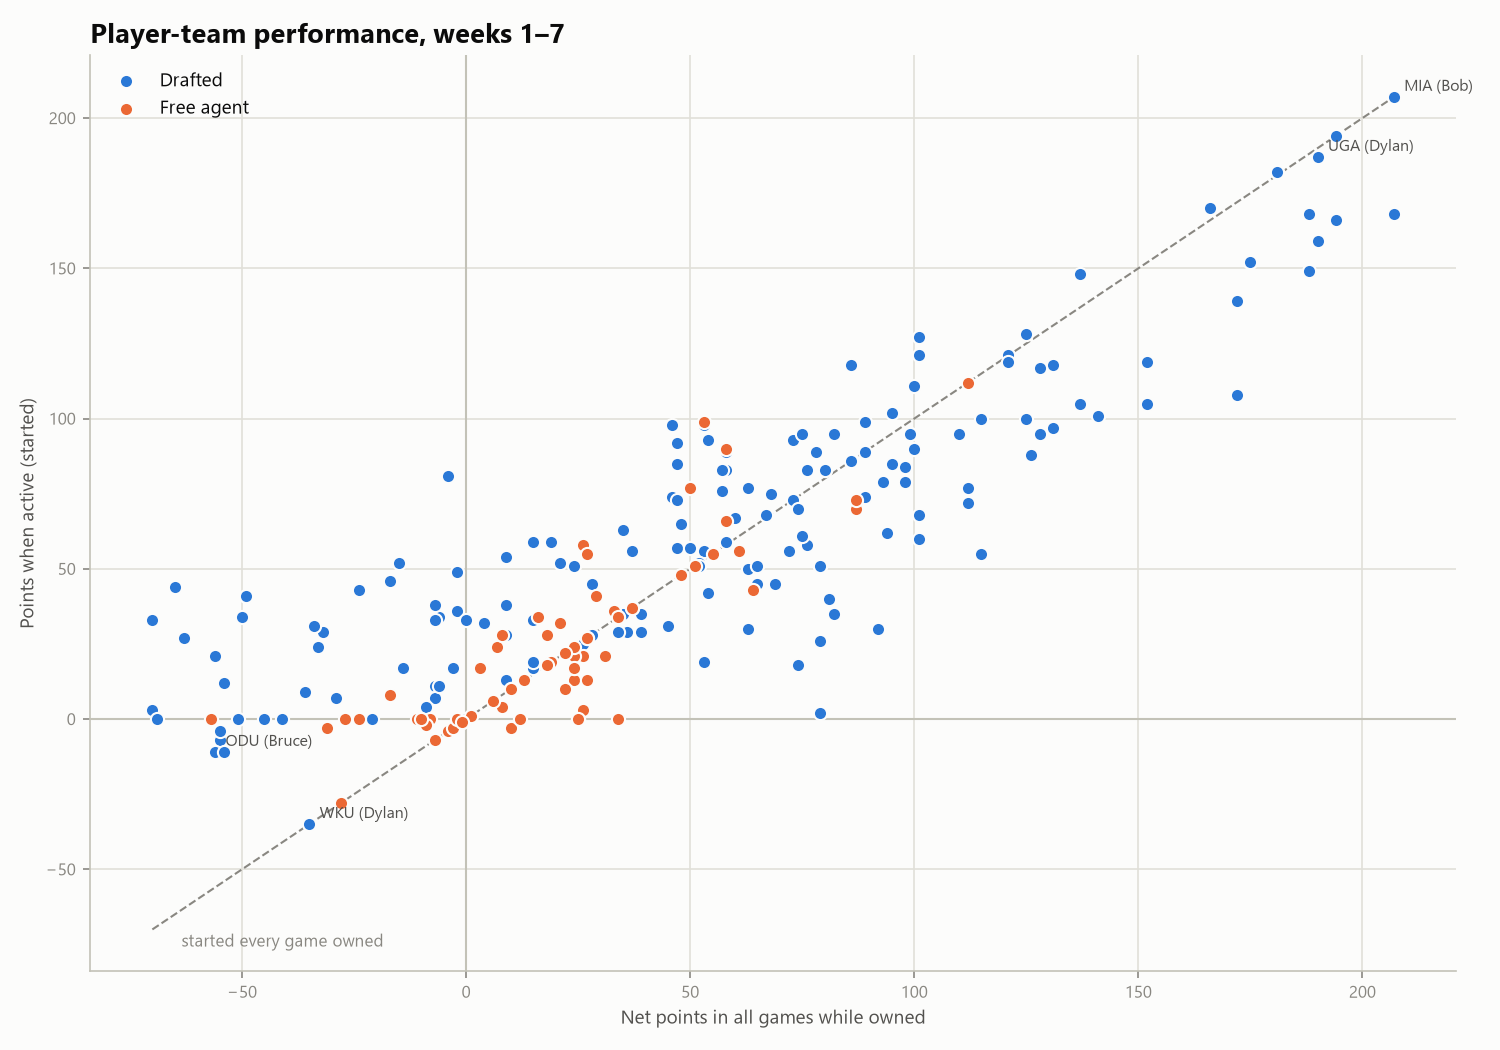
The x-axis is everything a team did while you owned it; the y-axis is what you actually banked from it. The dashed line is “started it in every game I owned it.” A dot on the line means you never benched it (Bob’s Miami, top right, is the cleanest example: 207 points owned, 207 banked). A dot below the line means you left points on the bench, so the further down and right, the more a good team sat while it was winning. A dot above the line means the games you benched it were the bad ones: the team was mediocre or even negative overall while you had it, but you played it in its good weeks.
Free agents (orange) cluster close to the line near zero. That’s expected: they’re usually picked up for a specific week, started, and then either dropped or not leaned on much.
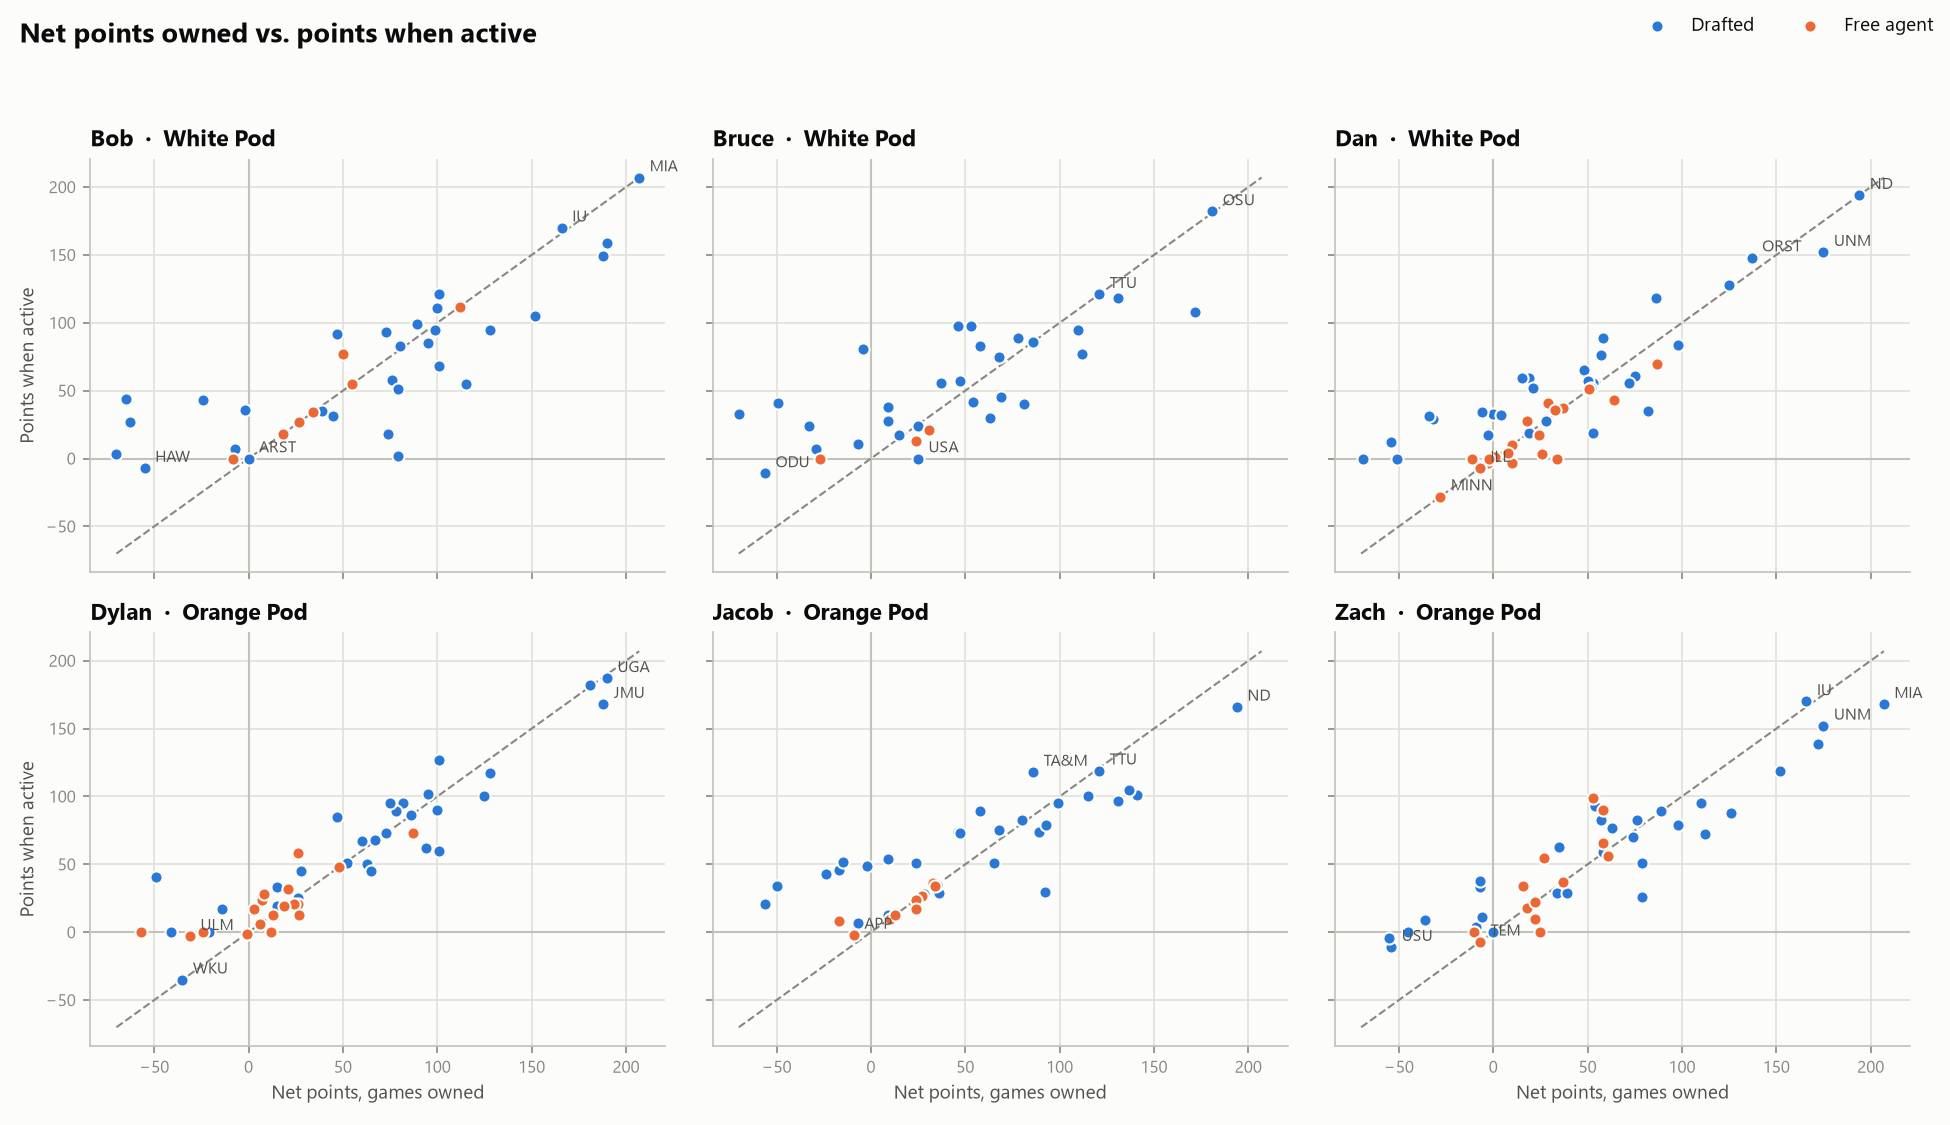
The same chart split by player, on shared axes so you can compare panels directly. Labels mark each player’s most notable teams.
Getting value out of bad teams
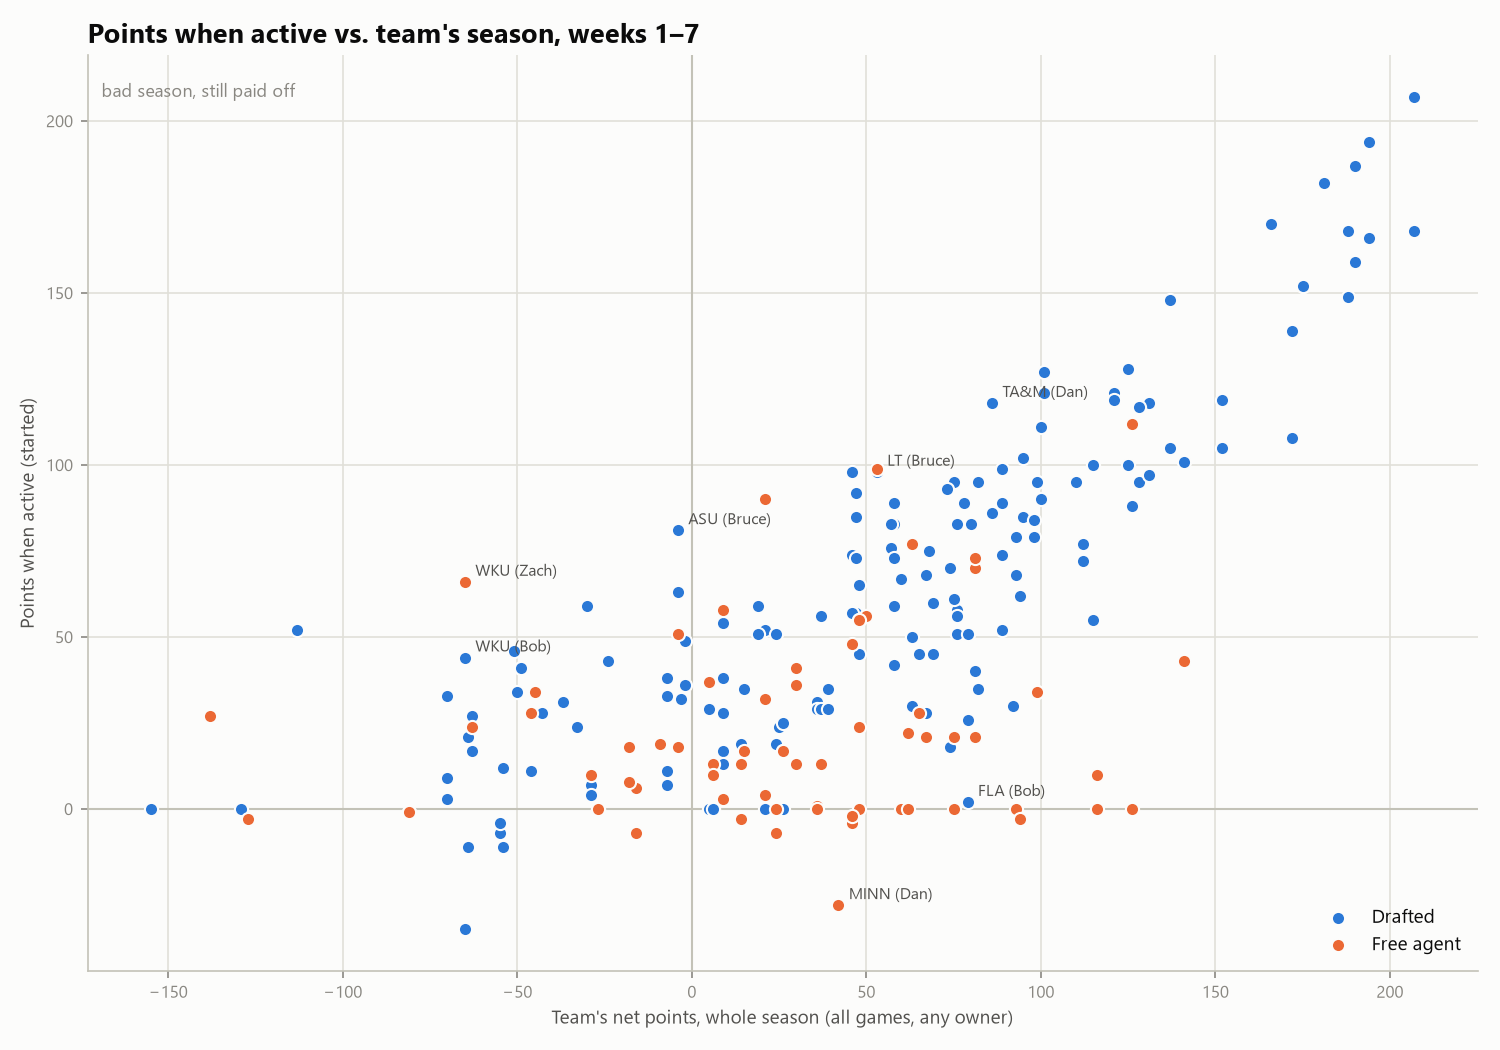
This swaps the x-axis for the team’s whole season, regardless of who owned it. The upper-left quadrant (“bad season, still paid off”) is the interesting one: teams that are underwater for the year, but returned positive points in the weeks someone started them. Labels mark the biggest pick edges. Bruce got 81 points out of Arizona State (−4 on the season) in 2 starts, and Zach got 66 out of a Western Kentucky team that’s −65 on the season. At the other end, dots far below the trend, like Dan’s Minnesota, are decent teams started in their worst week.
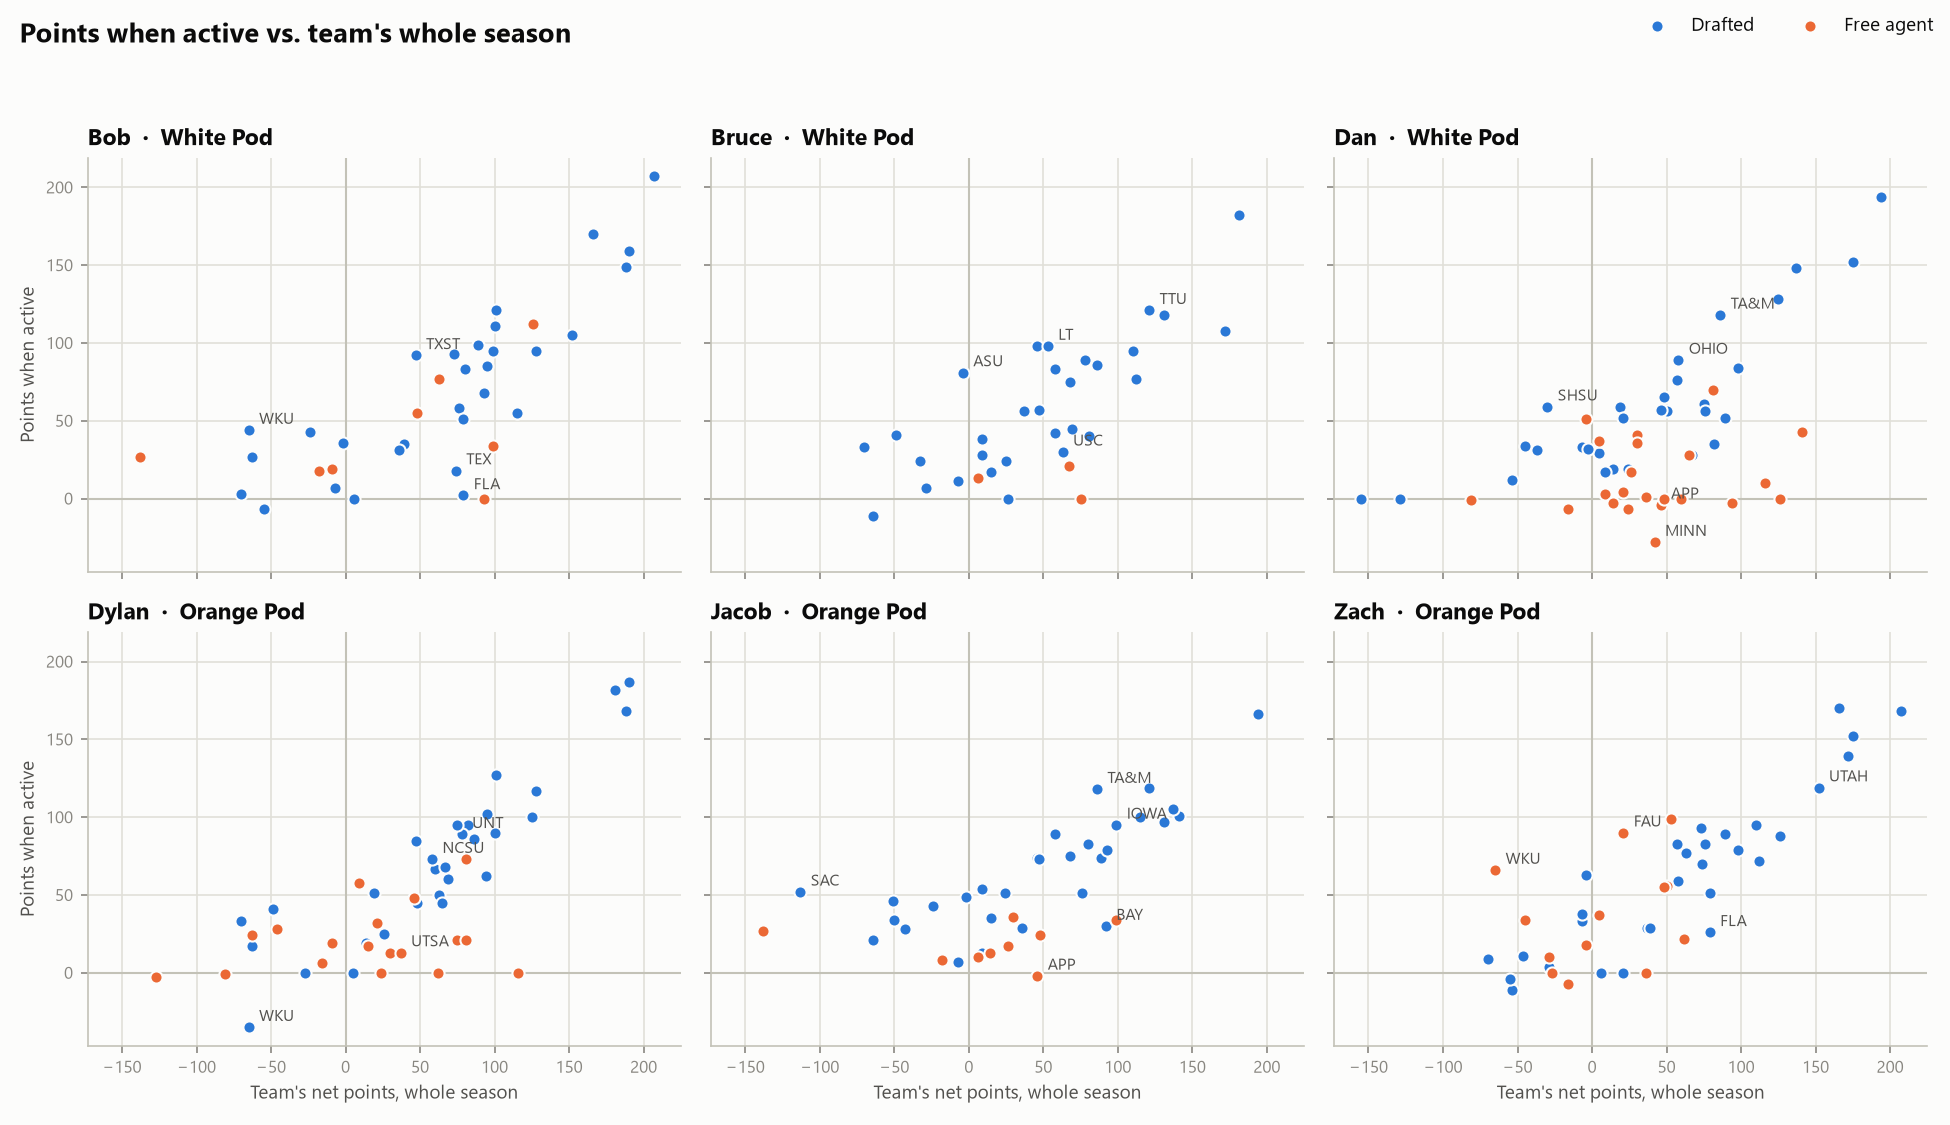
By player, with labels on each player’s biggest and smallest pick edges. Across all of us, starting teams that are net-negative for the season has produced about 226 points per player so far; Jacob has gotten the most out of them (315 points) and Dylan the least (129).
Usage
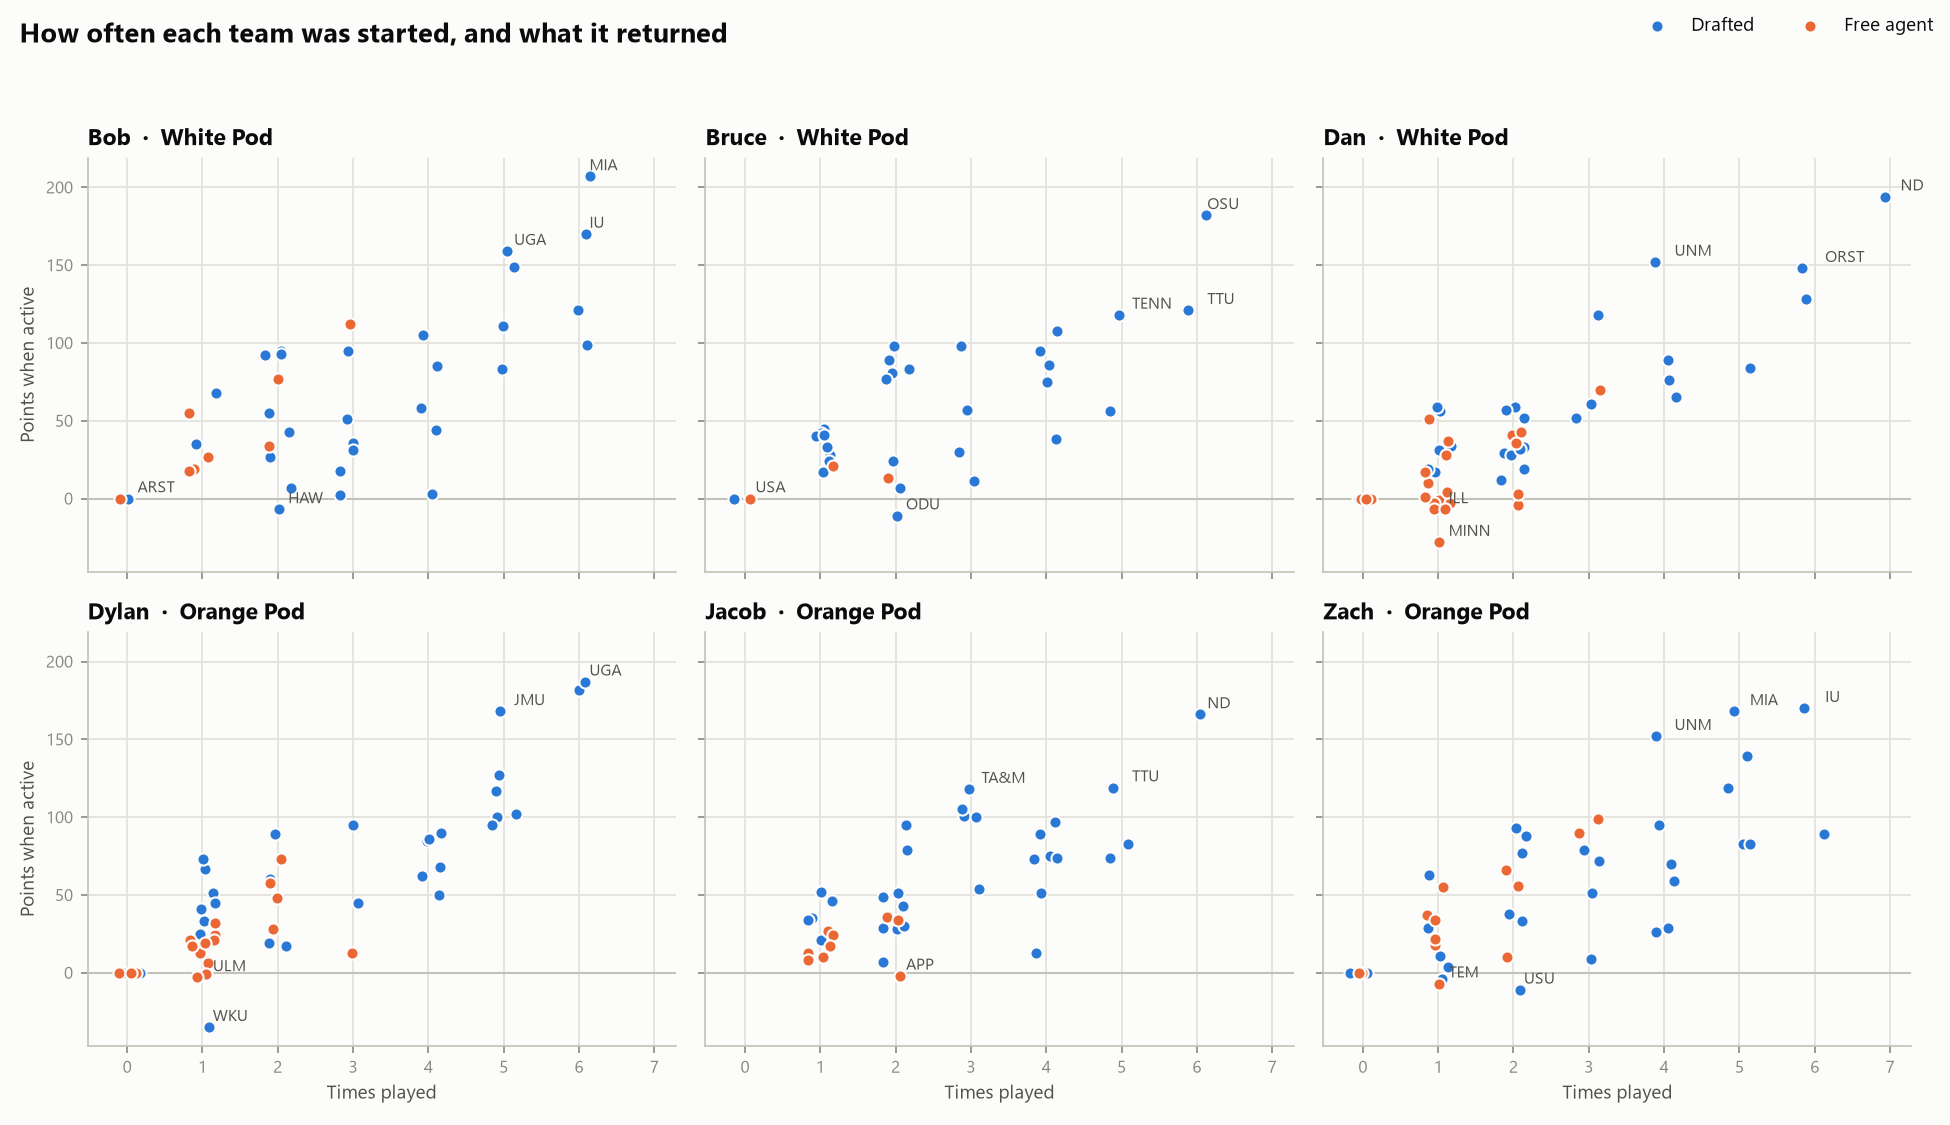
How often each team was started, and what it returned. The top-right dots are your workhorses: Dan has started Notre Dame in all 7 weeks for 194 points. Dots at zero on the x-axis are teams that have never been started.
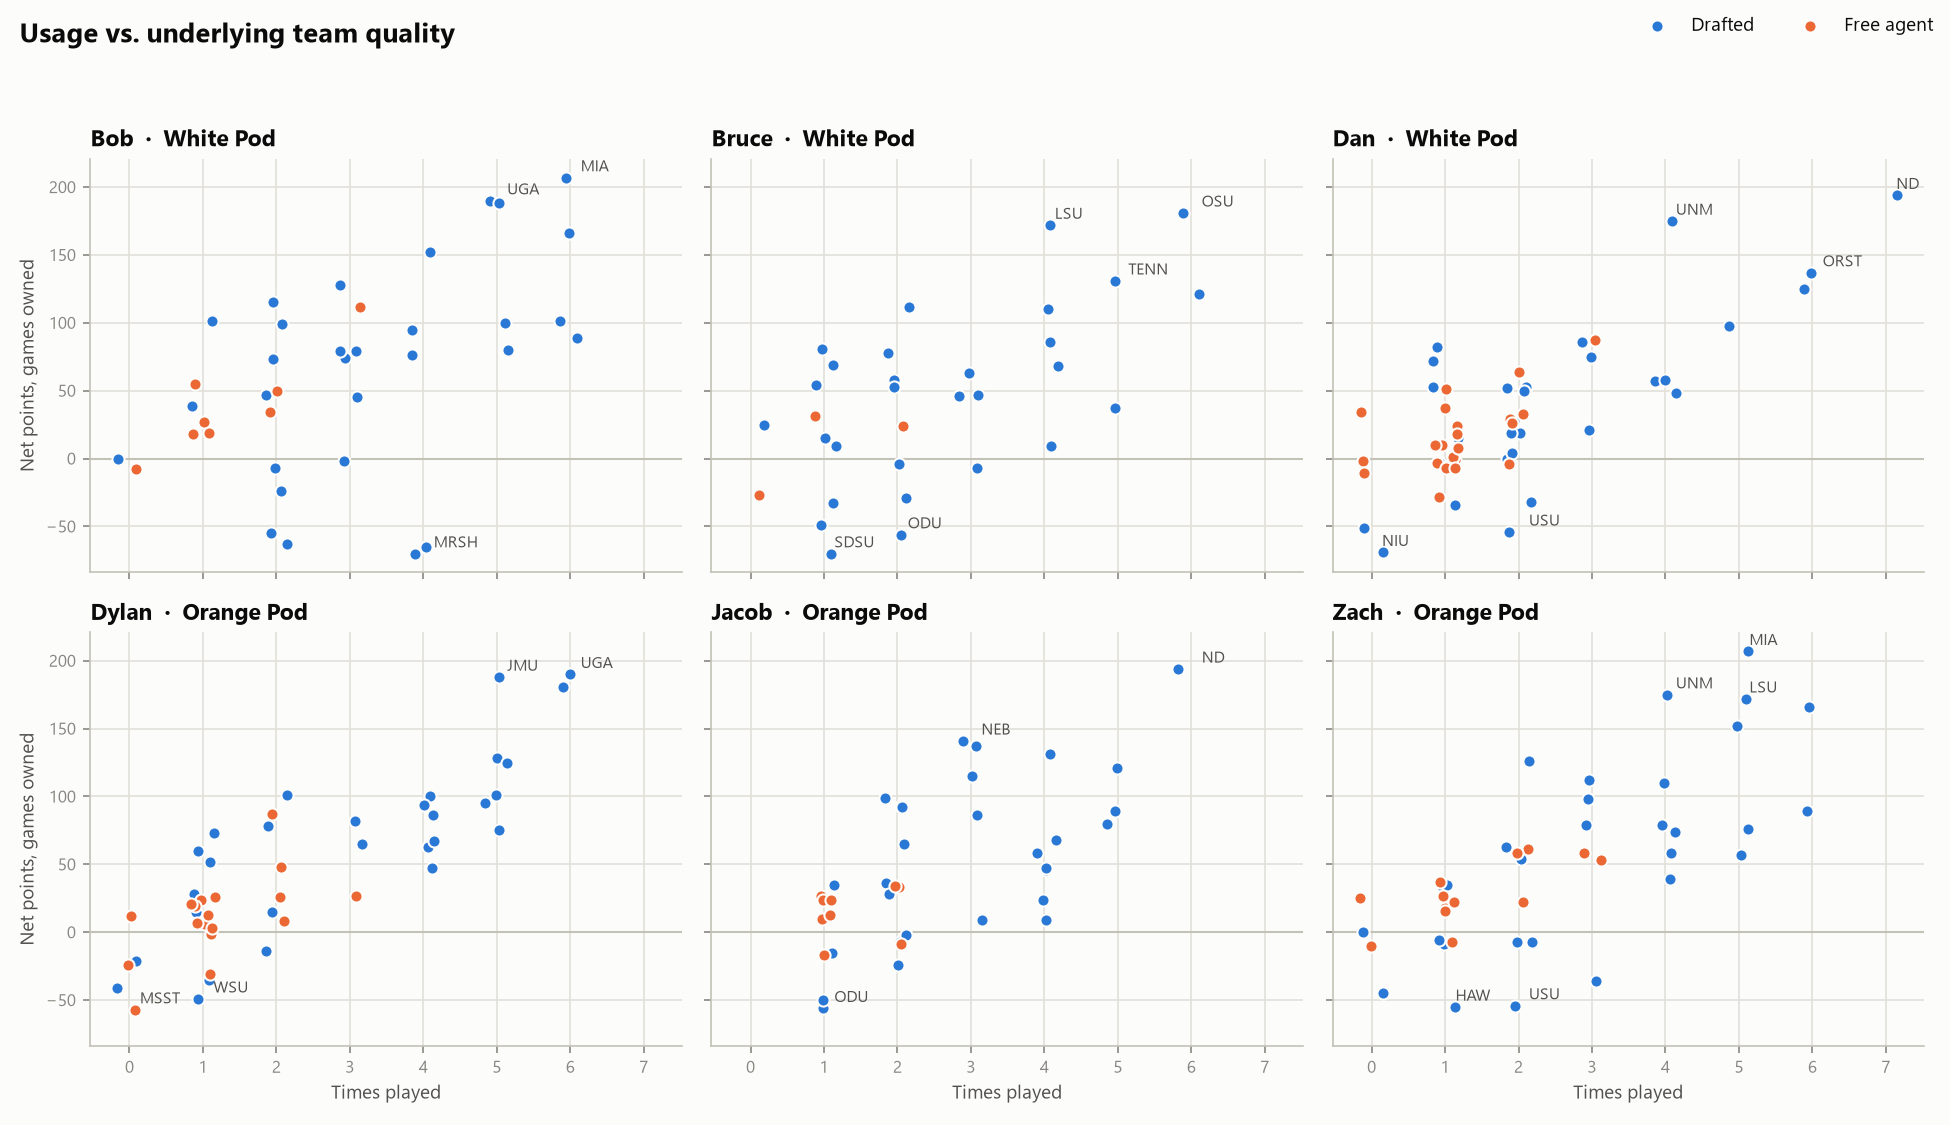
The same x-axis, but the y-axis is how good the team actually was while you owned it, started or not. This asks whether your best teams were your most-used ones. A dot high up but far left is a good team that didn’t get many starts, like Bruce’s LSU (+172 while owned, started 4 times for 108). A dot low but further right is a team you kept trusting that didn’t deliver, like Bob’s Marshall (4 starts, 3 points total, −70 while owned). Keep in mind times played is capped by byes and by the lineup itself: only one team per conference slot plus a handful of flexes, so two good teams from the same conference compete for starts.
Who plays like whom?
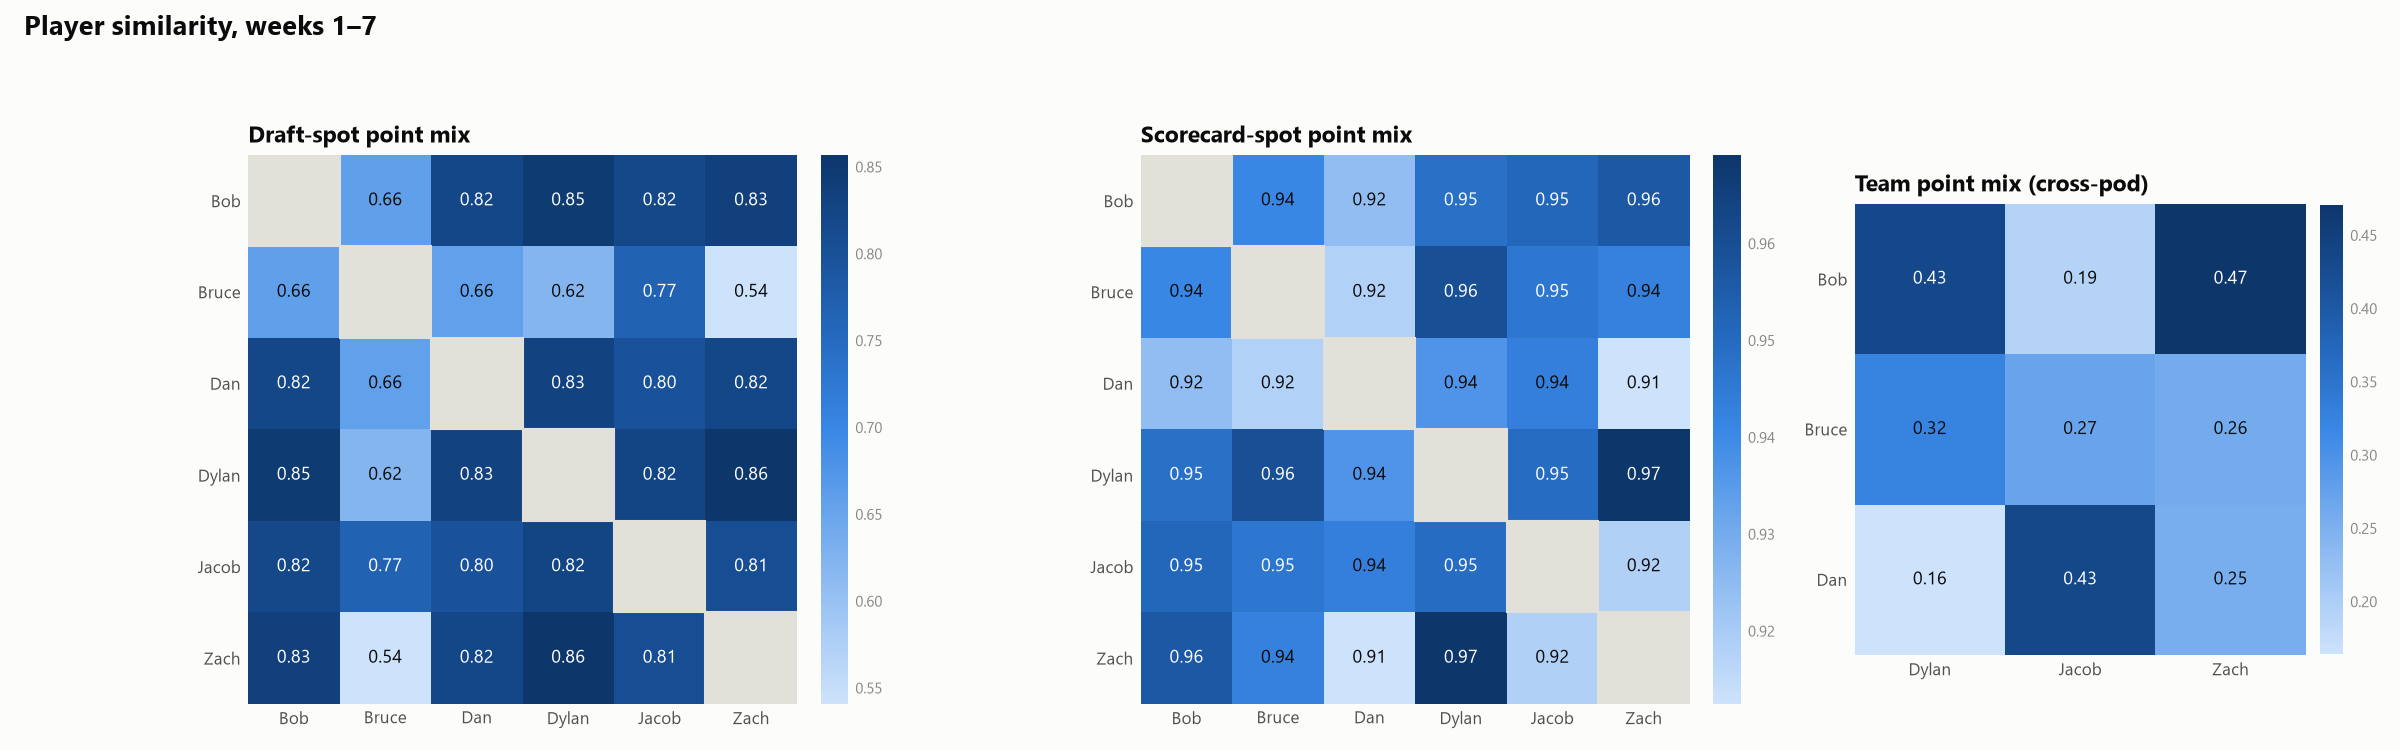
Each panel compares every pair of players by the mix of where their points come from, using cosine similarity: 1.00 means an identical mix, 0 means nothing in common. Total points don’t matter, only the proportions. Darker is more similar, and each panel has its own color scale because the three measures sit in very different ranges.
- Draft-spot point mix: share of points from each draft round, plus one bucket for all free agents. Dylan and Zach are the most alike (0.86). Bruce stands apart from everyone (0.54–0.77), mostly because he’s barely touched free agency: under 2% of his points have come from pickups, against an average of about 12%.
- Scorecard-spot point mix: share of points from each lineup slot (each conference, P4 flex, G6 flex, wildcard). Everyone fills the same 16 slots every week, so these all land at 0.91–0.97 and the differences are small. Dylan and Zach are again the closest pair (0.97).
- Team point mix: how much of each player’s points came from the same teams. This is cross-pod only, since two players in the same pod can’t roster the same team. Bob and Zach are the most alike (0.47): they share 16 teams, which supply 41–46% of each one’s points. Dan and Dylan share the most teams of any pair (17) but are the least alike (0.16), because they get their points from different ones.
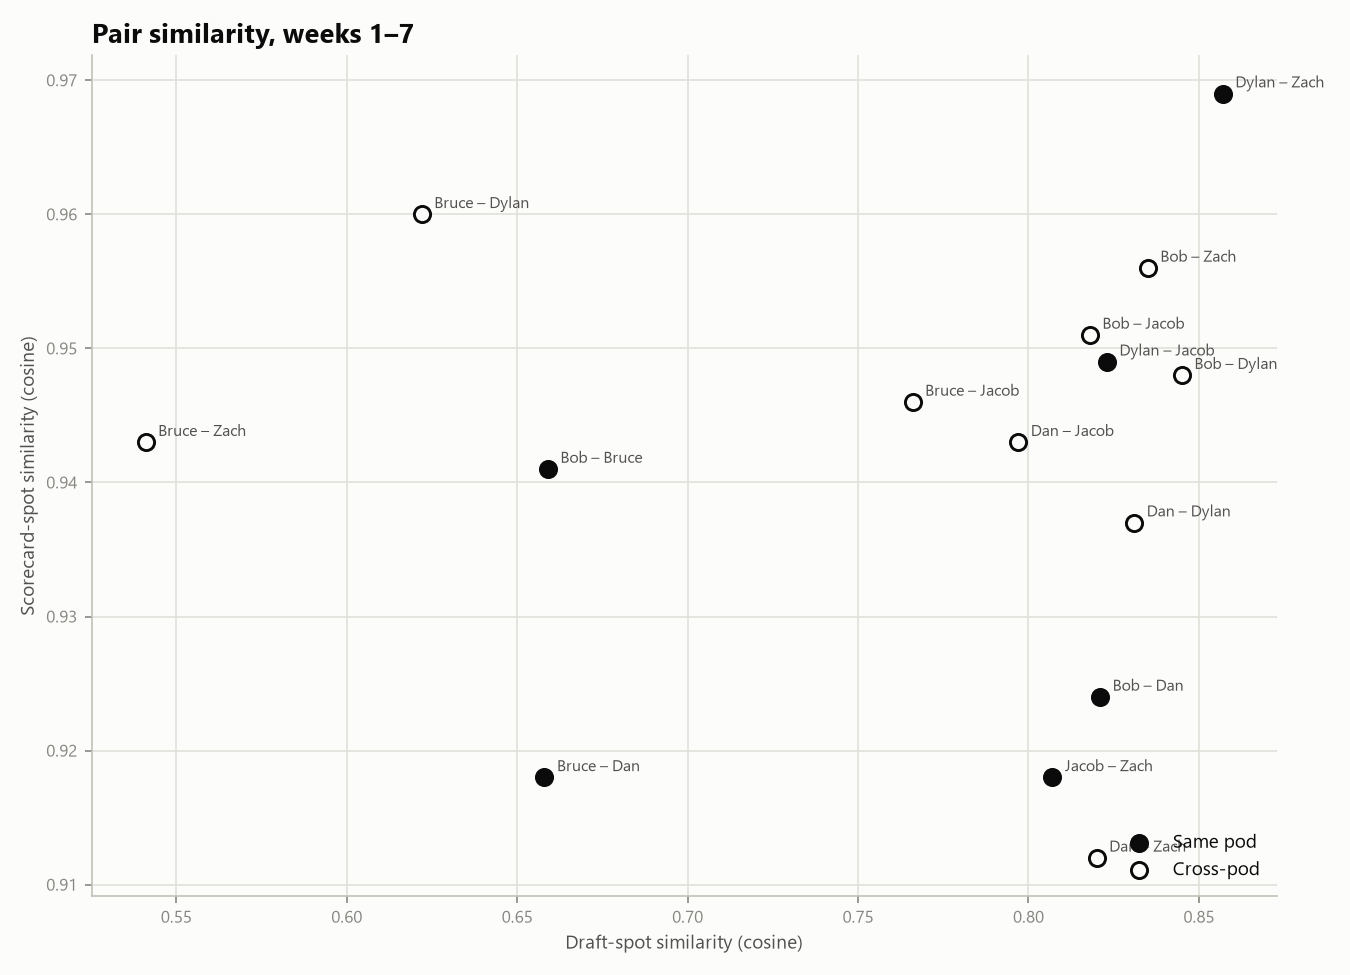
The first two panels above, combined into one chart. Each dot is a pair of players; filled dots are same-pod pairs and hollow dots are cross-pod. Pairs in the upper right drew their points from the same draft rounds and the same lineup slots, and Dylan–Zach is alone in that corner. Every pair involving Bruce sits on the left side, for the free-agency reason above.
What each remaining PVP game is worth
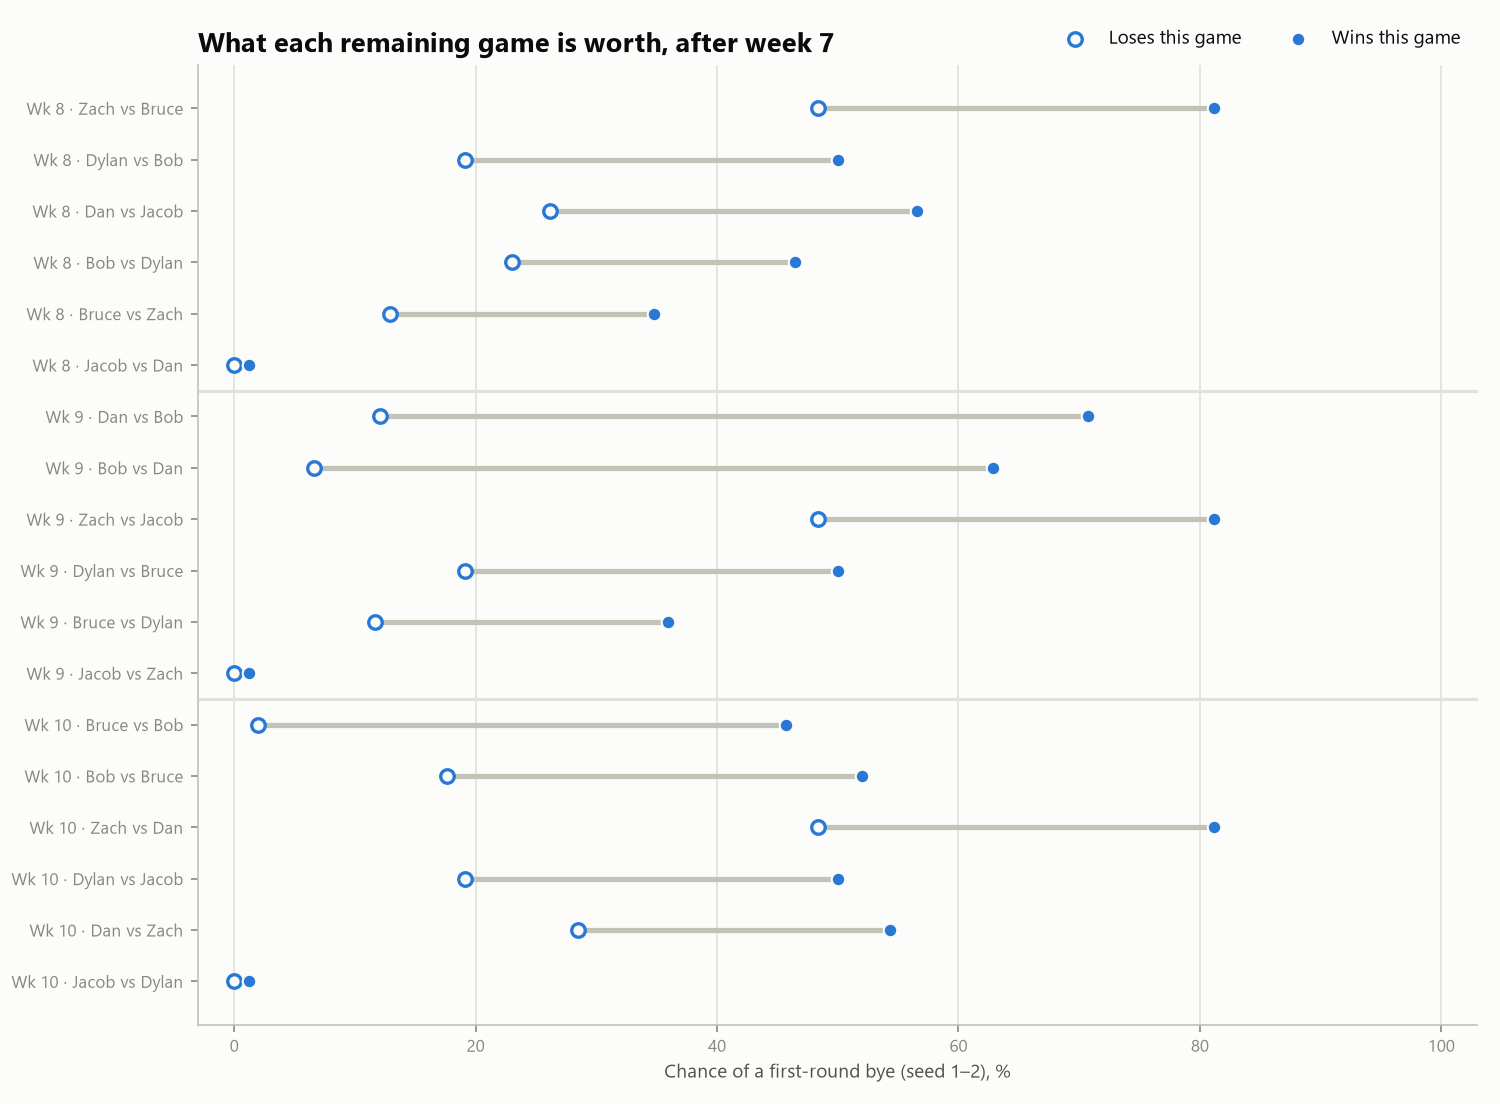
Seeds 1 and 2 get a first-round bye. Seed 1 is the best record overall, and seed 2 is the best record from the other pod. For every remaining regular-season PVP game, this shows the player’s chance of a bye if they win (filled dot) and if they lose (hollow dot), with every other game still open and every game treated as a coin flip. The longer the bar, the more that one game matters.
The biggest game left is Dan vs. Bob in week 9. A win takes Dan to about a 71% bye chance, and a loss drops him to 12%. Bob’s version of the same game is 63% vs. 7%. Zach’s bye chance is about 81% with a win and 48% with a loss in each of his three remaining games, and Dylan’s is about 50% vs. 19%. Jacob’s bars are nearly invisible: a bye is essentially out of reach (about 1% at best), so his remaining games are about seeding, not the bye.
Week 11
The charts and data behind the 2026 Week 11 Recap: the wild card round against the spread, the season against the spread, and the match play race over the last two weeks.
Wild card round: who beat the line
Every team each player started in the wild card round, sorted by how far it beat or missed its line. Each label gives the team’s actual margin vs. its line-implied margin, and bars to the right covered. The panel headers add up those line-implied margins into a projected score and compare it to the actual one.
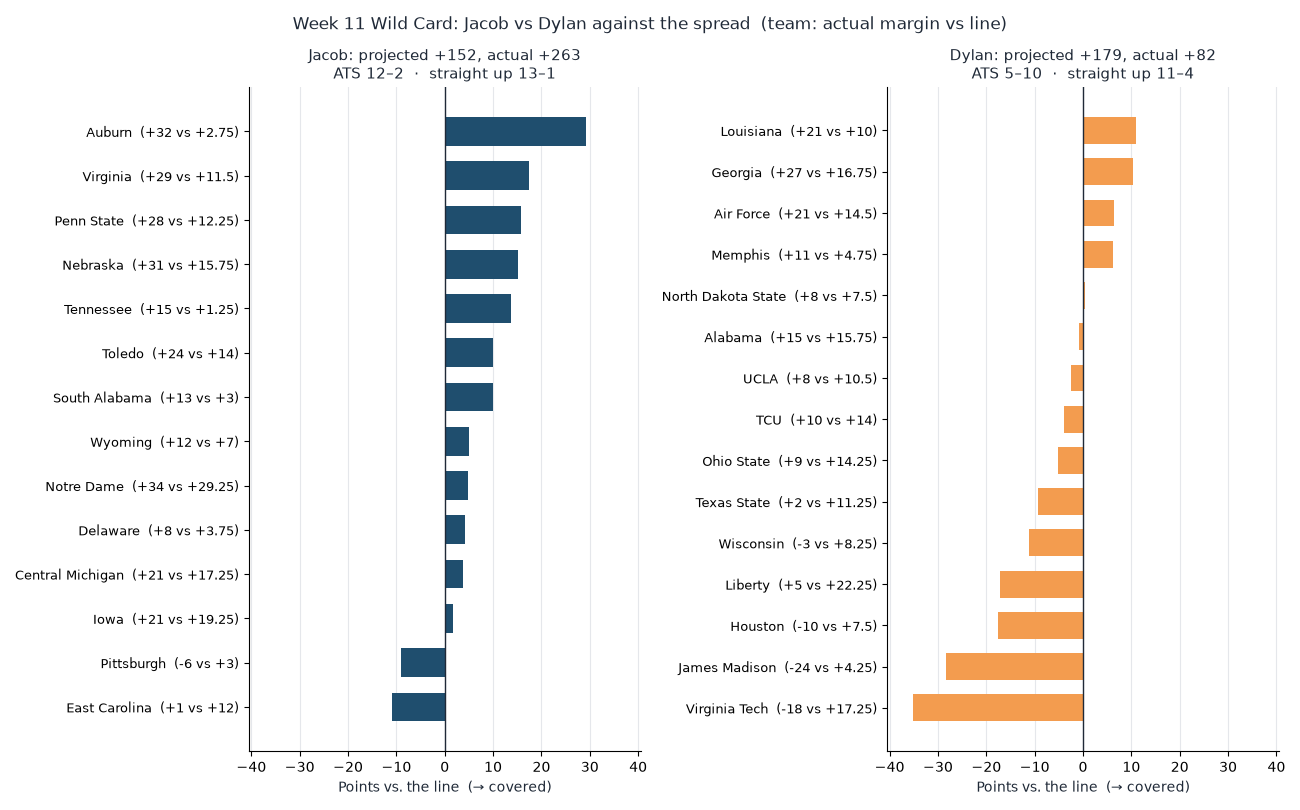
On paper Dylan was the favorite, projected +179 to Jacob’s +152. Jacob went 12–2 against the spread and scored +263; Dylan went 5–10 and scored +82.
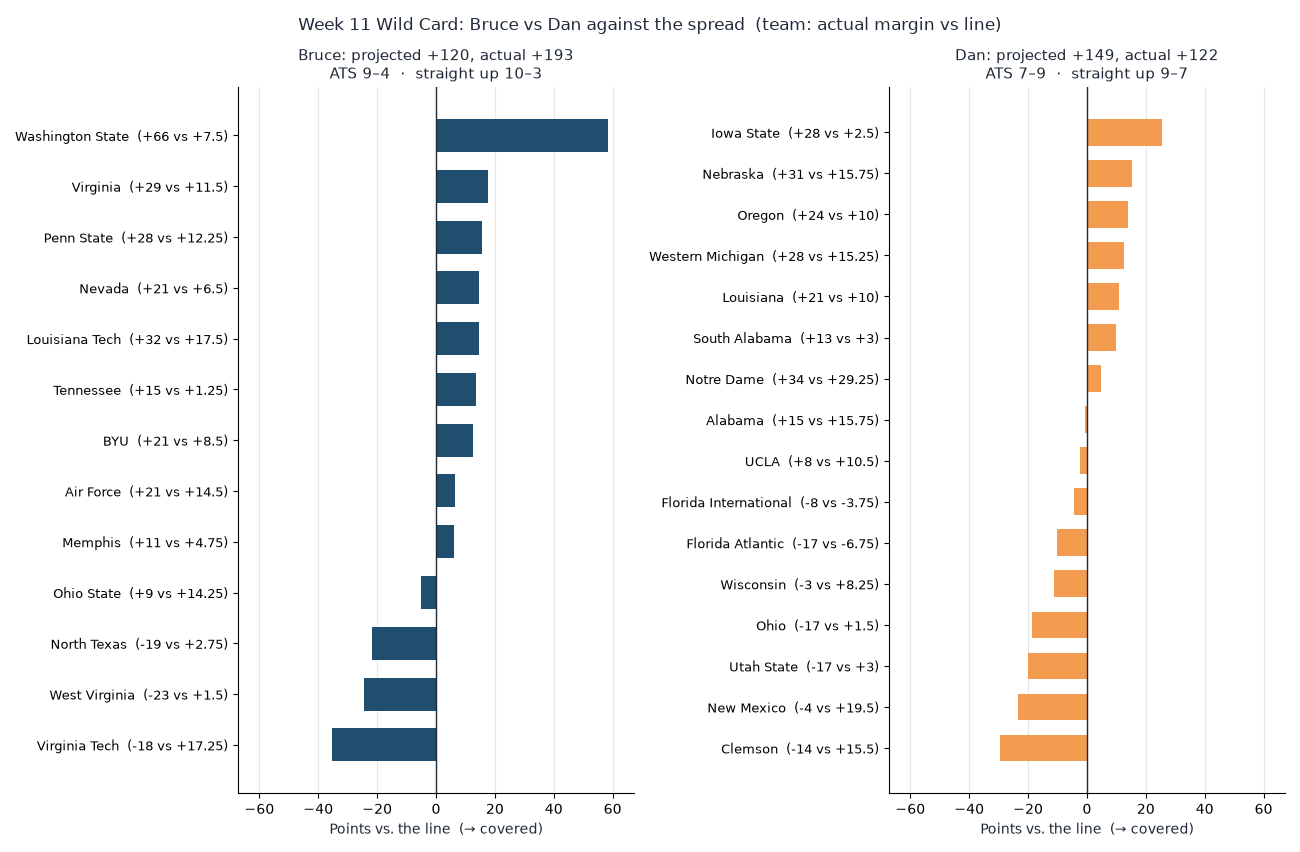
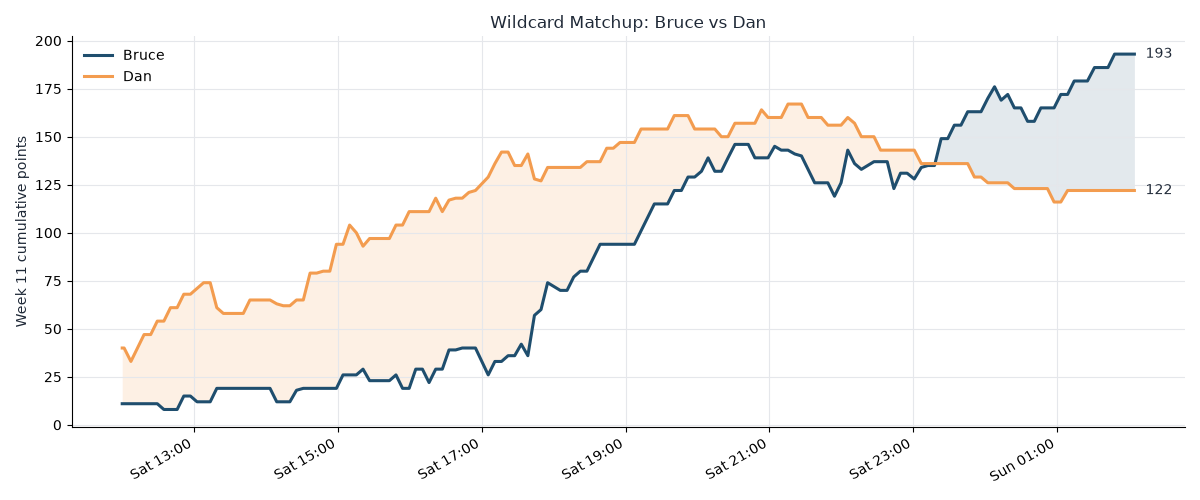
Dan was projected +149 to Bruce’s +120. Bruce went 9–4 against the spread for +193, with Washington State alone beating its line by 58. Dan went 7–9 for +122.
Wild card round: how the day played out
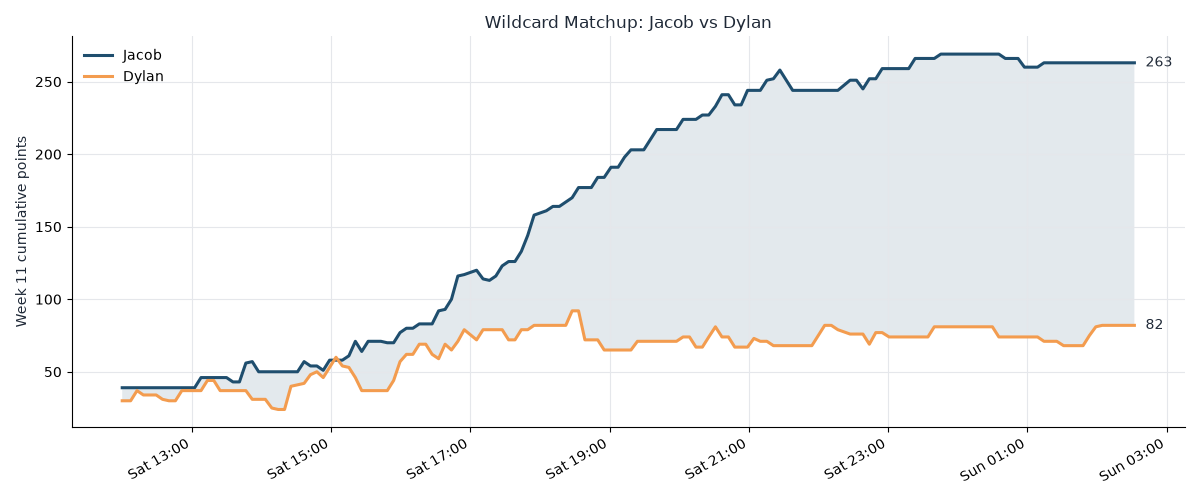
The running scores through the day, the same charts as in the recap.
If they’d played every week
What each wild card matchup would have looked like in weeks 1–10 if the two players had faced each other every week. Bars above zero are weeks the first-named player would have won. Weeks marked “actual H2H” are the ones where they really did play.
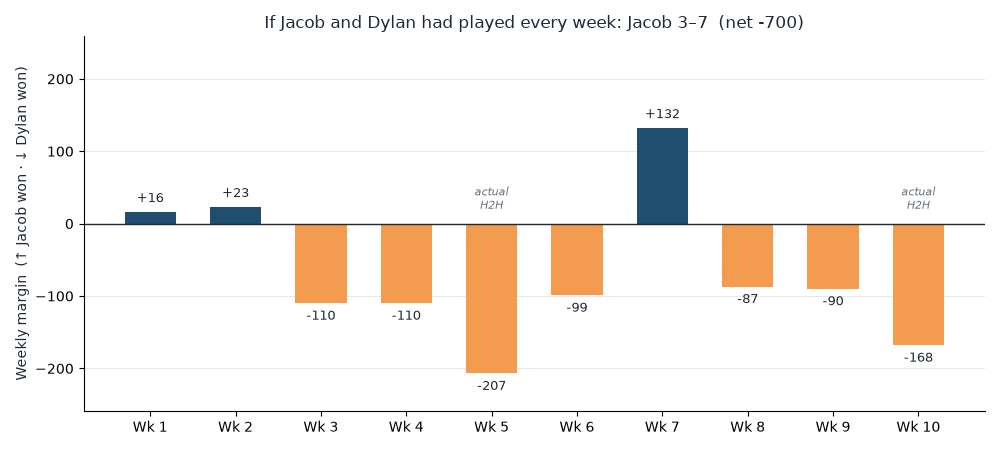
Jacob would have gone 3–7 against Dylan, net −700, which is what makes his wild card win the upset.
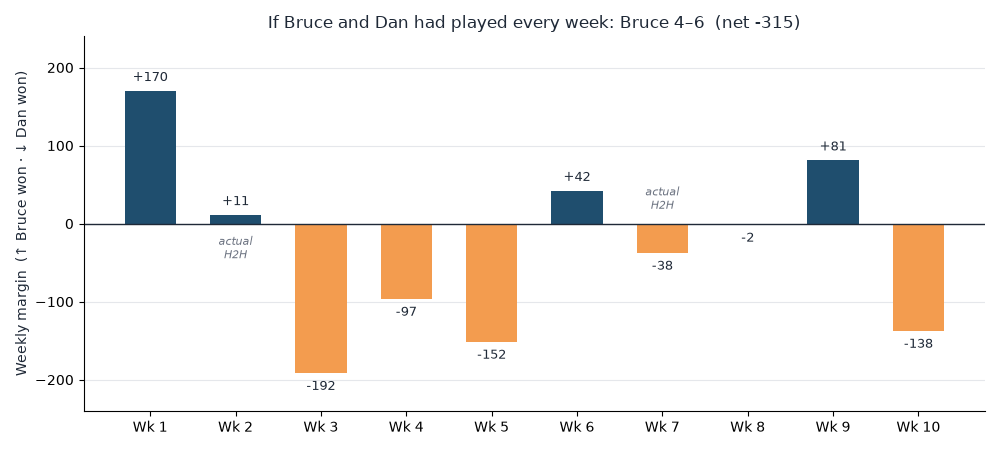
Bruce would have gone 4–6 against Dan, net −315, with week 8 decided by 2 points.
The line vs. what actually happened
In the next four charts, each dot is one team-game with a betting line. The x-axis is the team’s actual margin and the y-axis is the margin the line implied (the negative of the spread). The dashed line is “landed exactly on the number”, so dots to its right covered. Since the pods have separate rosters, each team has an owner in each pod: color shows its White pod owner and shape its Orange pod owner, with grey or diamond meaning unowned in that pod. Labels mark the biggest misses against the line.
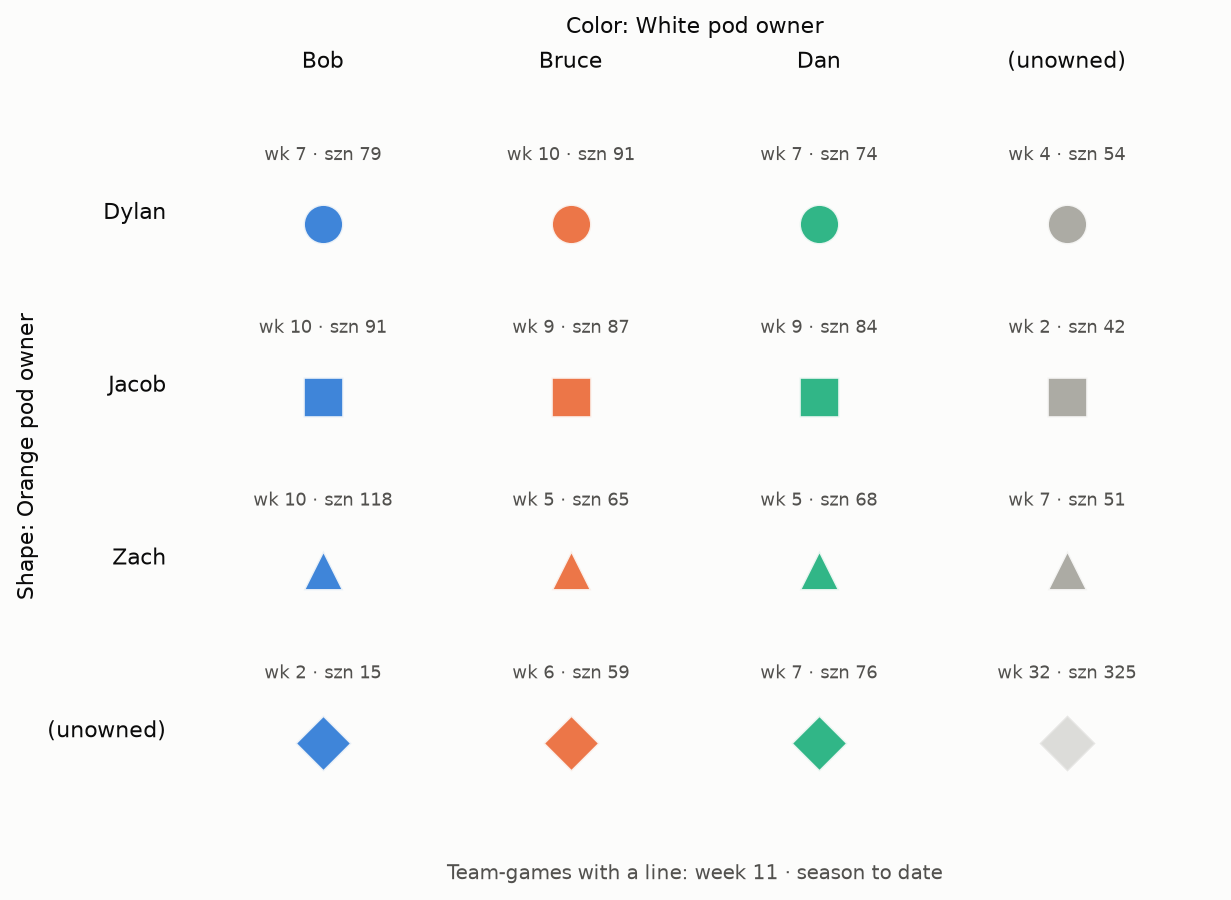
The legend, with how many team-games fall in each owner combination, for week 11 and for the season to date.
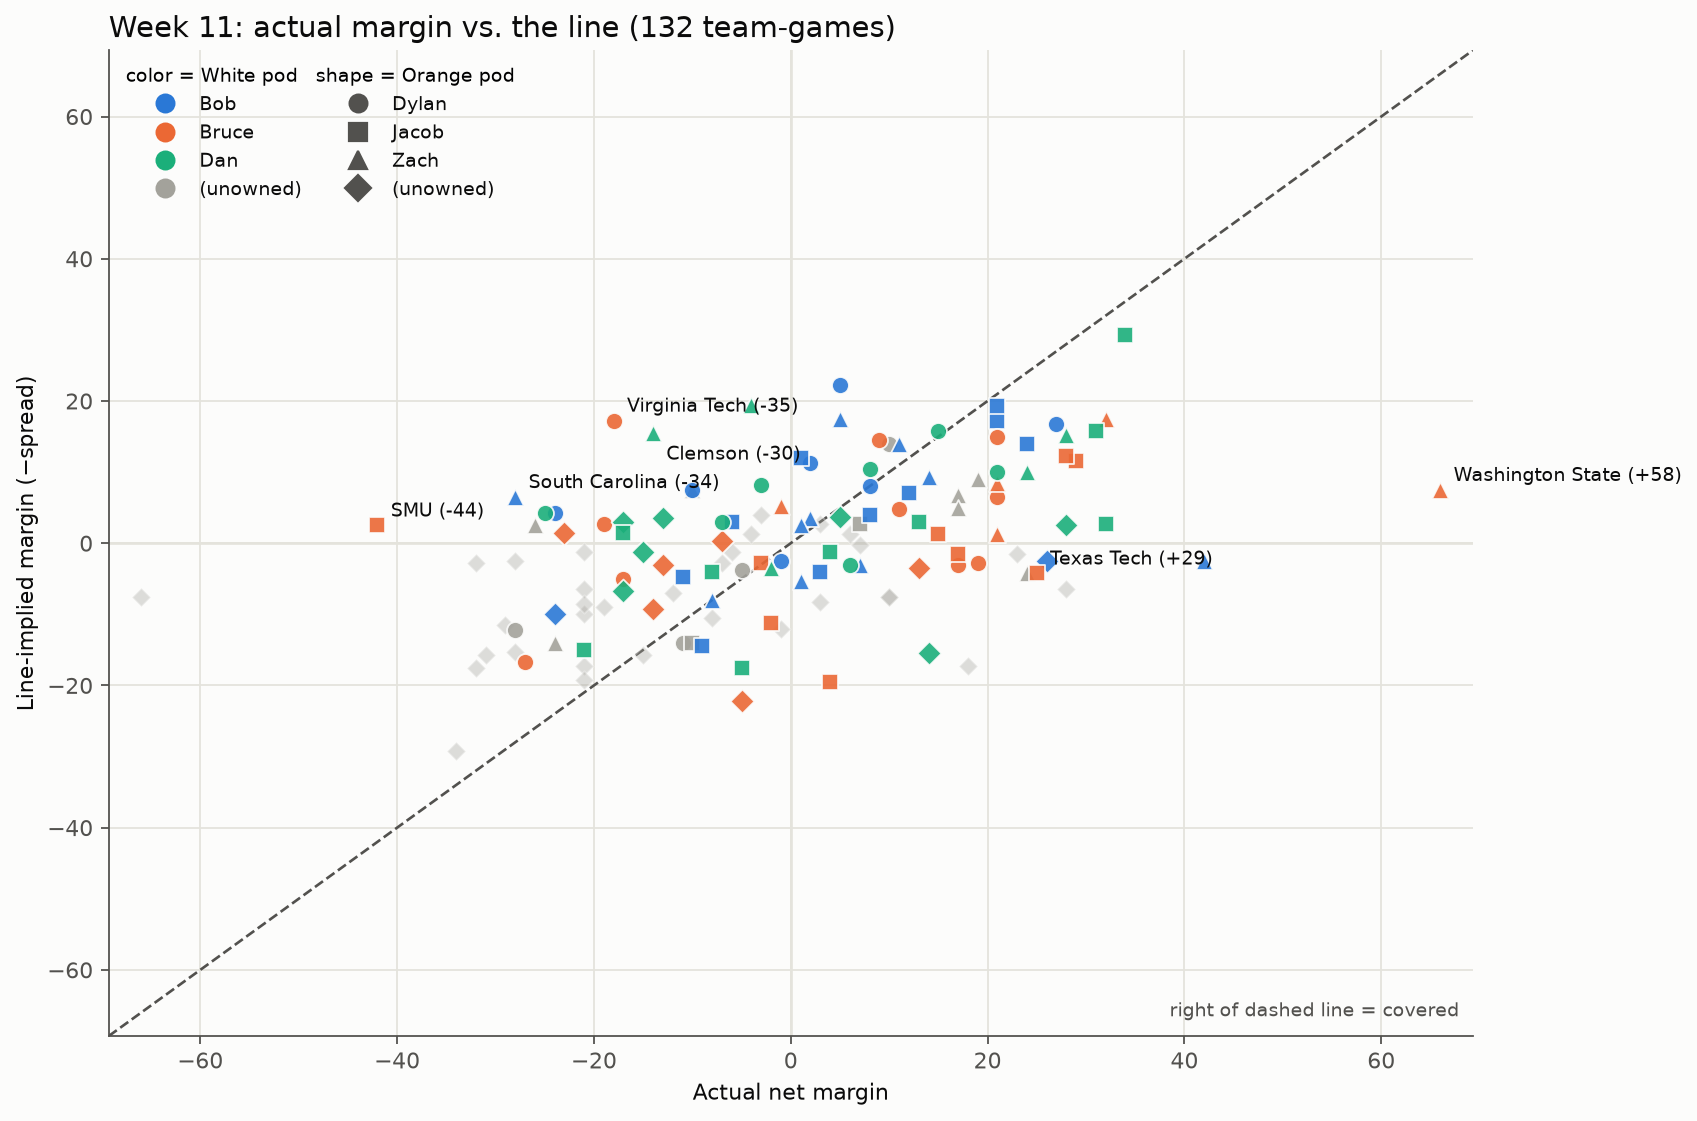
Week 11 only, 132 team-games.
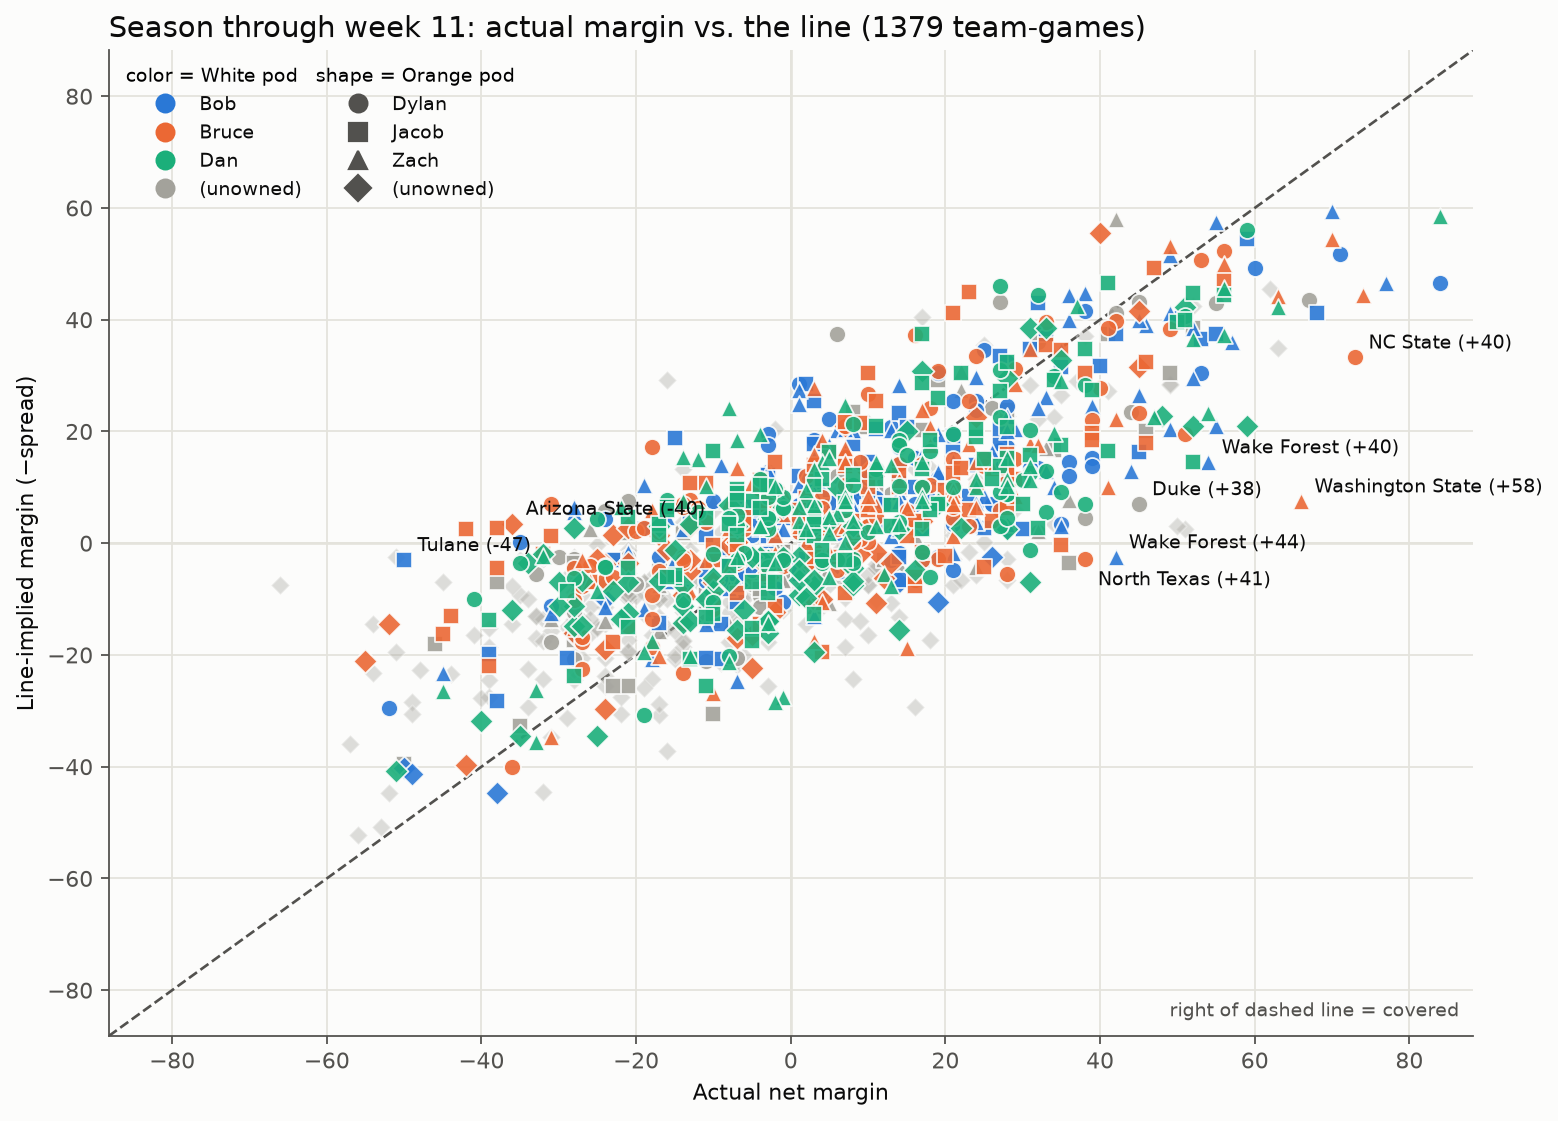
The whole season through week 11, 1,379 team-games.
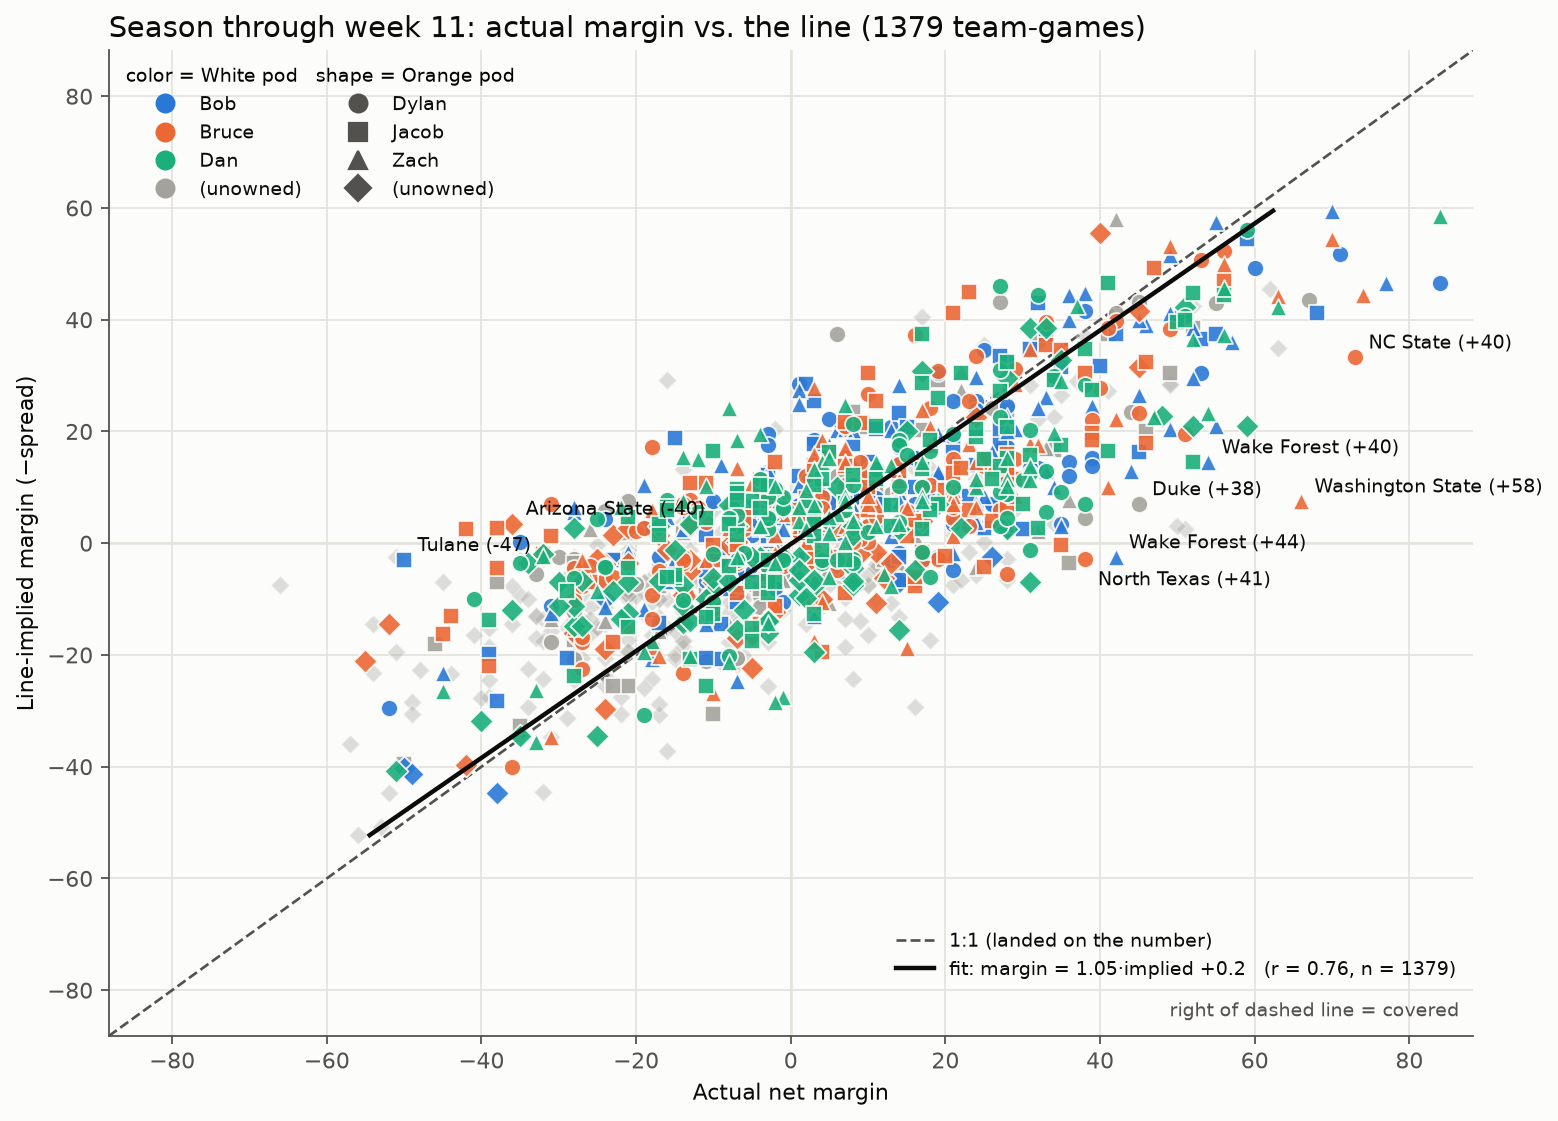
The same chart with a fitted trend line: margin = 1.05 × implied + 0.2 (r = 0.76). The lines are essentially unbiased on average, but any single game misses by a lot. That’s the luck in “ATS luck”.
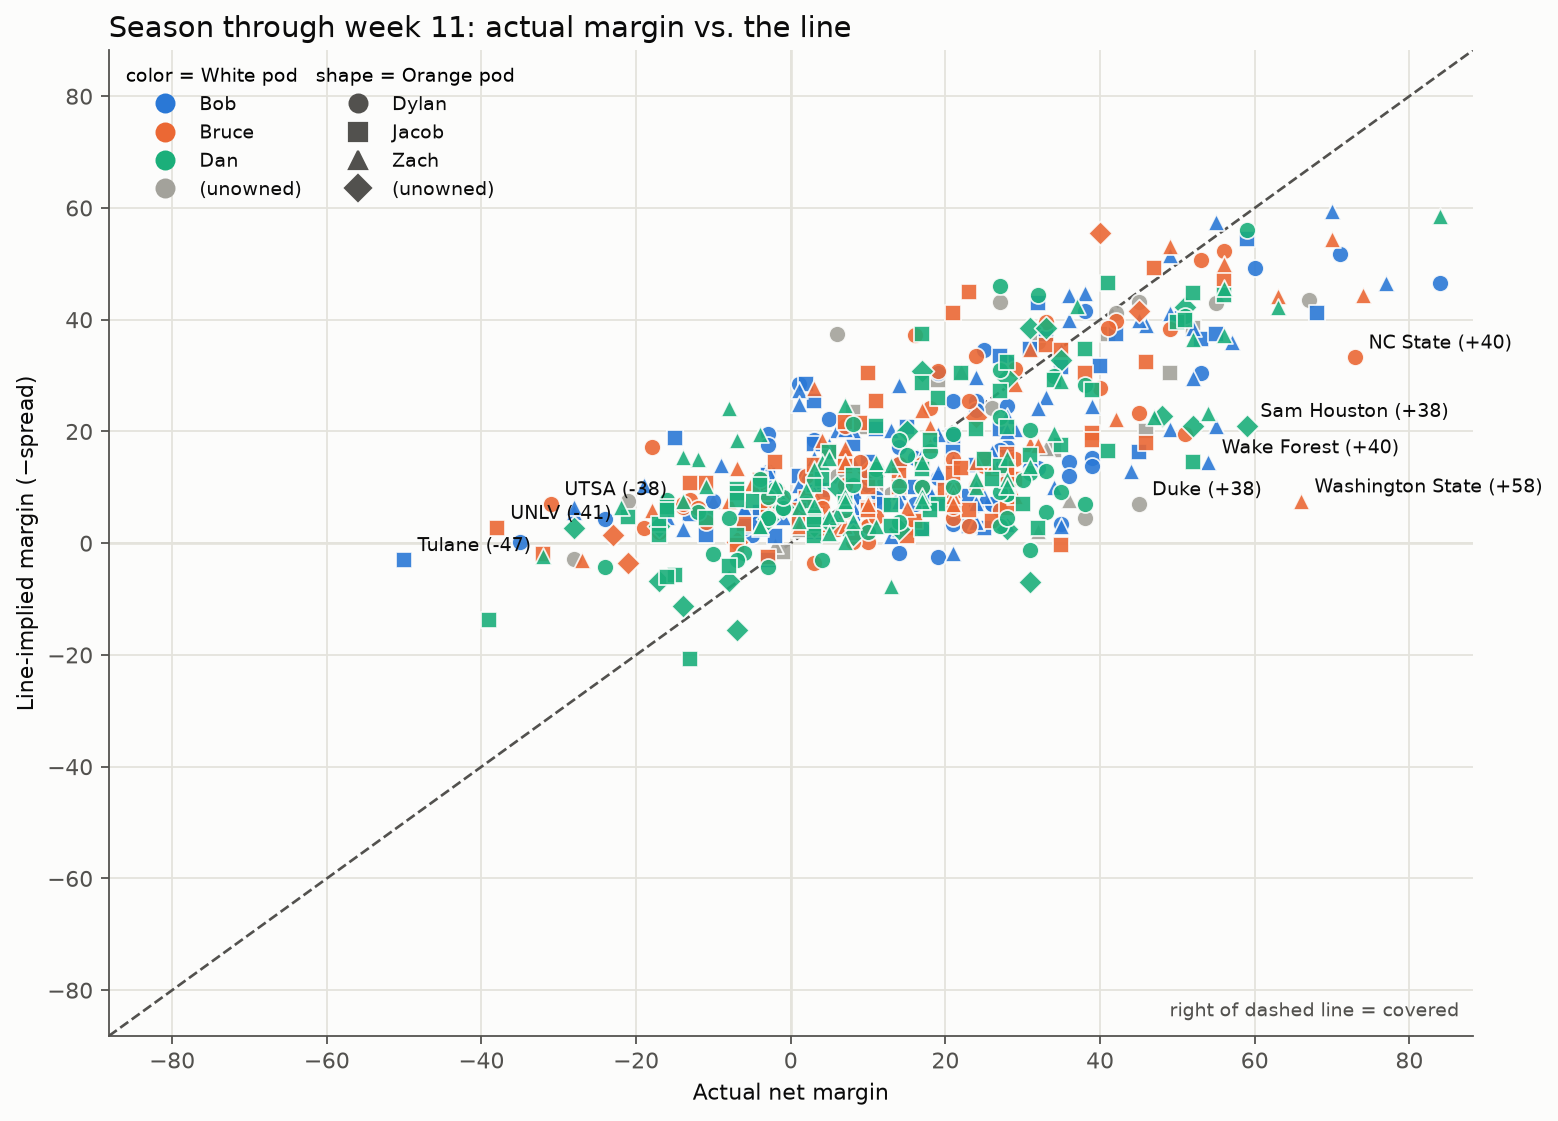
Only the team-games someone actually started. Almost all of them sit above zero on the y-axis, so lineups are overwhelmingly built from favorites.
Match play race: weeks 12–13
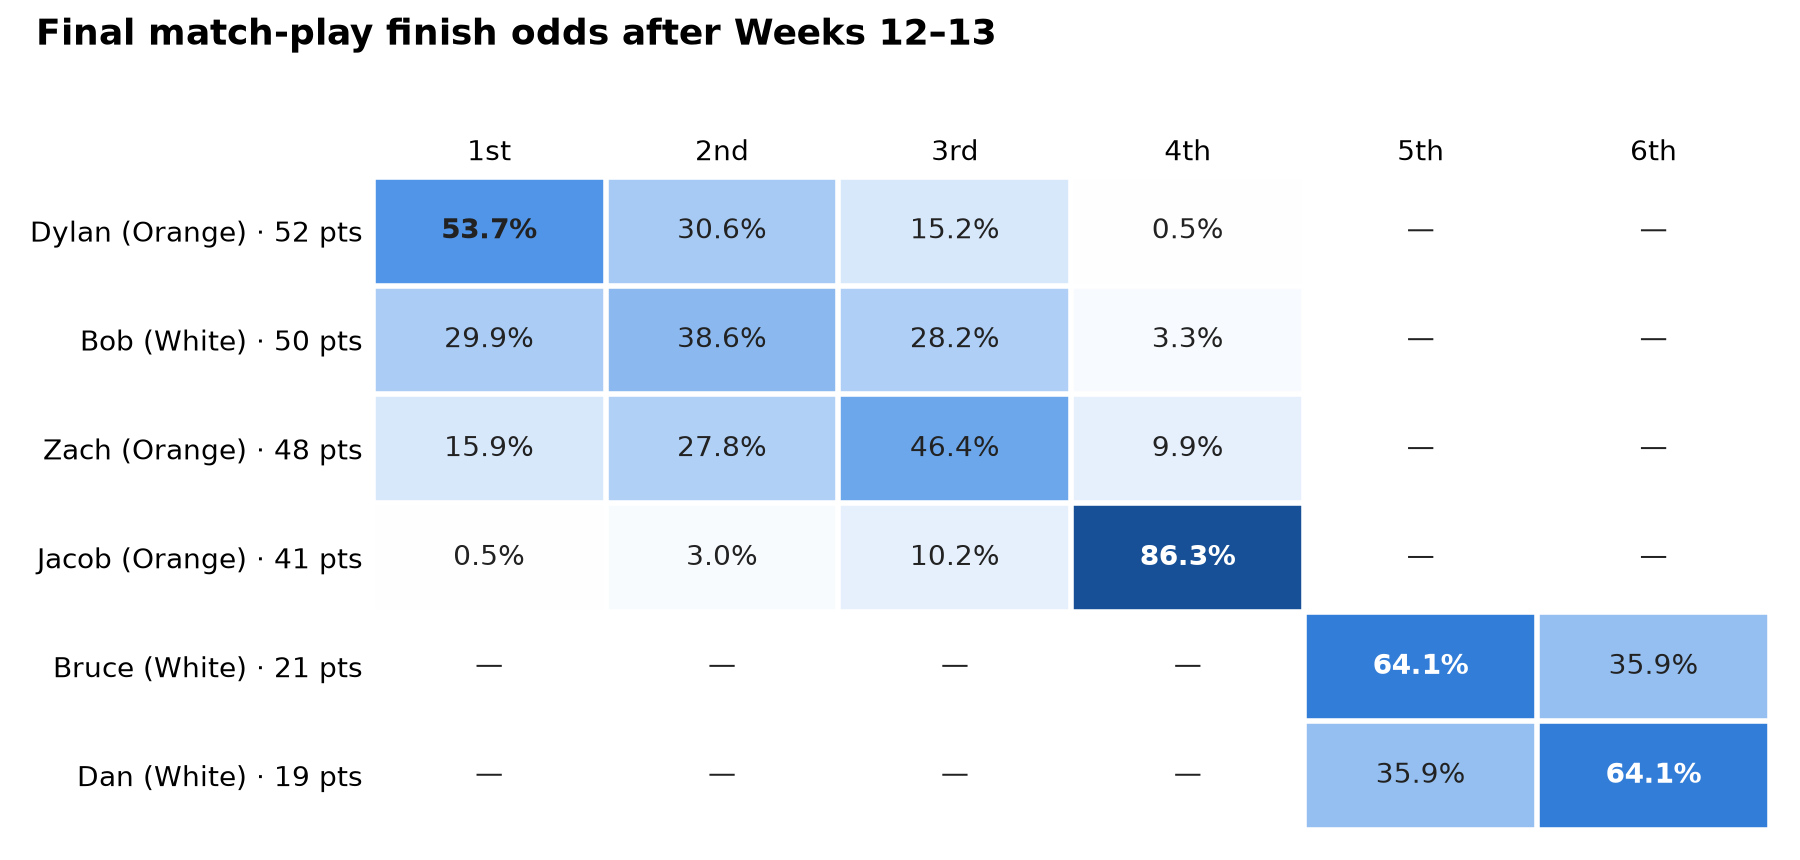
Each player’s chance of each final match-play finish. For each of the last two weeks, every finishing order of the six players is combined with each pod-vs-pod result. Outcomes that can’t happen are dropped, which leaves 1,080 per week and 1,166,400 two-week combinations, each weighted equally. Bruce and Dan can only finish 5th or 6th. Jacob can’t drop below 4th, and nobody in the top 4 is mathematically eliminated from 1st.