CFB Fantasy — Week Recap
Commissioner’s Notes
Week 7 is down and we’ve now reached the midpoint of the season. It was a pretty exciting week in CFB with 16 games decided by 3 or fewer points or in OT. In our game we had a very close 1-2-3 battle with only about 20 points per spot of separation. Now that we’re at the halfway point, I’ll look at our performances in the game so far: how we’ve fared, who drafted well and who’s hitting the free agents the hardest, who’s getting the most out of their teams, and the PVP picture moving into the last 3 weeks of playoff seeding games.
Choke Job of the Week
…was nearly Miami, but they were saved by a borderline holding call. There weren’t a lot of choke jobs, maybe Georgia and Texas, but those were still good teams. The best contender for CJOW is Temple, who was nearly a 20-point favorite over arguably one of the worst teams in FBS.
The Week Ahead
PVP Matchups
- #1 Zach (5-2) vs #5 Bruce (3-4)
- #2 Dylan (5-2) vs #4 Bob (3-4)
- #3 Dan (3-4) vs #6 Jacob (2-5)
Games of the week
-
Tuesday: South Alabama @ Marshall. South Alabama is a slight favorite and tied for the lead in their division with LA Tech, who they play next week. A loss here would put them a big step back, especially if they lose again next week.
-
Wednesday: only one game, New Mexico State @ Sam Houston, and they’re both terrible.
-
Thursday: any/none; these are all ~80% ESPN projected winners and ~10-point favorites.
-
Friday: Duke @ Virginia. Both teams are pretty far down the ACC standings, but they’re close to each other.
-
Saturday Noon: either LSU @ Auburn or Indiana @ Michigan. Both feature a much better team on the road, but both home teams have high ceilings and could steal a win. I could see one or both of these underdogs winning. Bonus Sicko Bowl: Akron (#134 FPI) @ Kent State (#135 FPI). They have a single win between them against an FBS opponent, and that opponent is Ball State (#131 FPI).
-
Saturday Afternoon: Tennessee @ South Carolina, one of the biggest toss-ups of the whole week, with huge playoff implications for Tennessee, as a loss would put them really behind the sticks with Kentucky coming to town next week. Bonus: yet another Sicko Bowl, this one even sicker, with Sac State (dead-last FPI, winless against FBS) @ Ball State (only win against #129 Bowling Green). If you like bad football, the MAC is feeding you this weekend.
-
Saturday Primetime: several good games in this time slot, so I’ll just list all of them:
- Virginia Tech @ Clemson: two inconsistent but not terrible teams, and both really can’t afford to lose if they want to stay in the ACC hunt.
- Georgia State @ Arkansas State: both are in the middle of their divisions, so they’re similarly fighting to stay alive, and both are near .500, so this one may end up being important for bowl eligibility for one or both of them.
- Ole Miss @ Texas: can Texas right the ship? They’ve had two consecutive losses to decent teams, but not teams good enough for a team of Texas’s alleged caliber to lose to.
- USC @ Wisconsin: Wisconsin has been sneaky good after a week 1 blowout against ND, so this is a good test for USC, which has played a relatively soft schedule so far.
- UTSA @ Tulane: UTSA is separating from the pack in the AAC and Tulane clearly hasn’t completely disappeared, as we saw this week against Memphis.
-
Saturday Late Night: only two good games, but they both look great: a very good G6 matchup in North Dakota State @ New Mexico, where the winner will probably be one of the most likely G6 playoff teams after Boise and JMU, and a ranked-vs-overranked Houston @ Utah, the latter of whom is absurdly ranked ahead of Tennessee because AP voters don’t know what they’re talking about.
Season So Far Recap
Last week, at the almost-halfway point, I looked at how we’ve done collectively vs the spread. This week, I’ll look at how we’ve done within the confines of the game.
Draft and Free Agent Performance
To jog your memory about the draft, you can re-read the Draft Recap post from right after the draft.
In the figure below, I’ve plotted the number of points we’ve received by round, the number of times we’ve played them, and the average number of points per time they’ve been played.
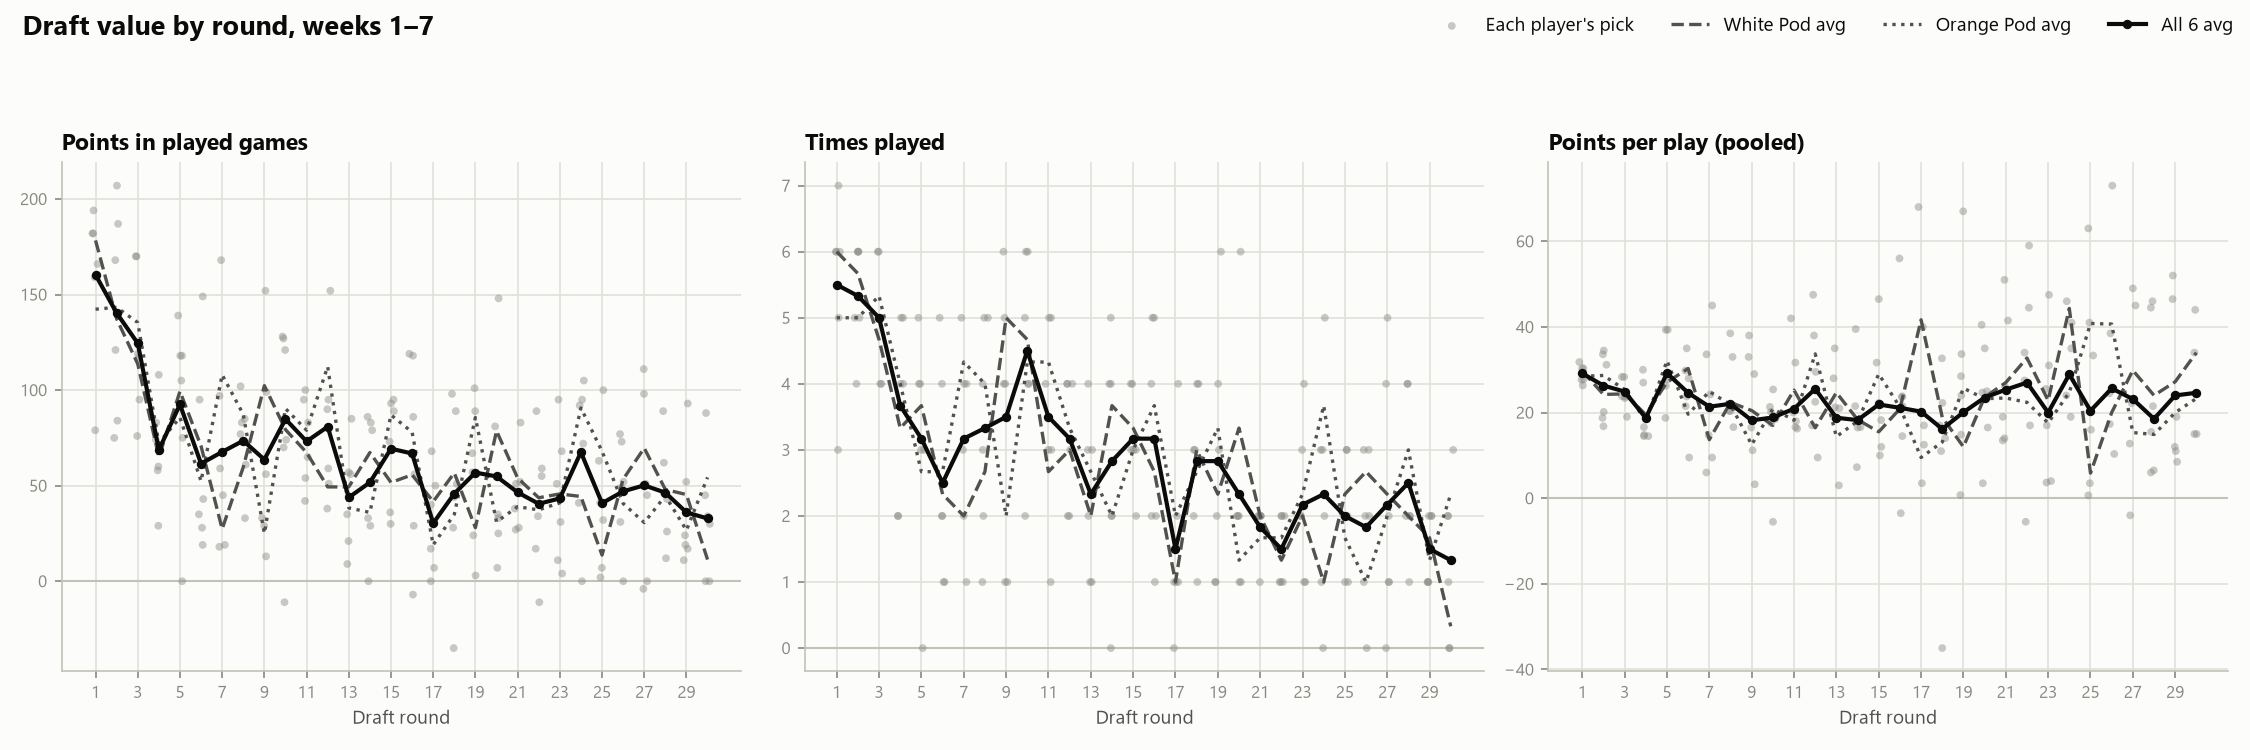
If you notice, the total points played decreases greatly after the first few rounds, which were also the rounds where we had a near-consensus between pods. These are the top overall performers – worth a ton of points because they’ve been favorites nearly every week and have been winning by plenty every week. But if you look at the later rounds, the points per play doesn’t tail off and even slightly increases, while the times played falls off the map. In my opinion, this signals at least decent drafting by us collectively – we’re not wasting early picks on teams (except, shudder, Oregon) and we’re making efficient use of our last few picks to round out the rosters. In between, we picked up our G6 and “depth” teams that can be used in a pinch when our elite teams are on a bye, but are not the workhorses that the early rounds are.
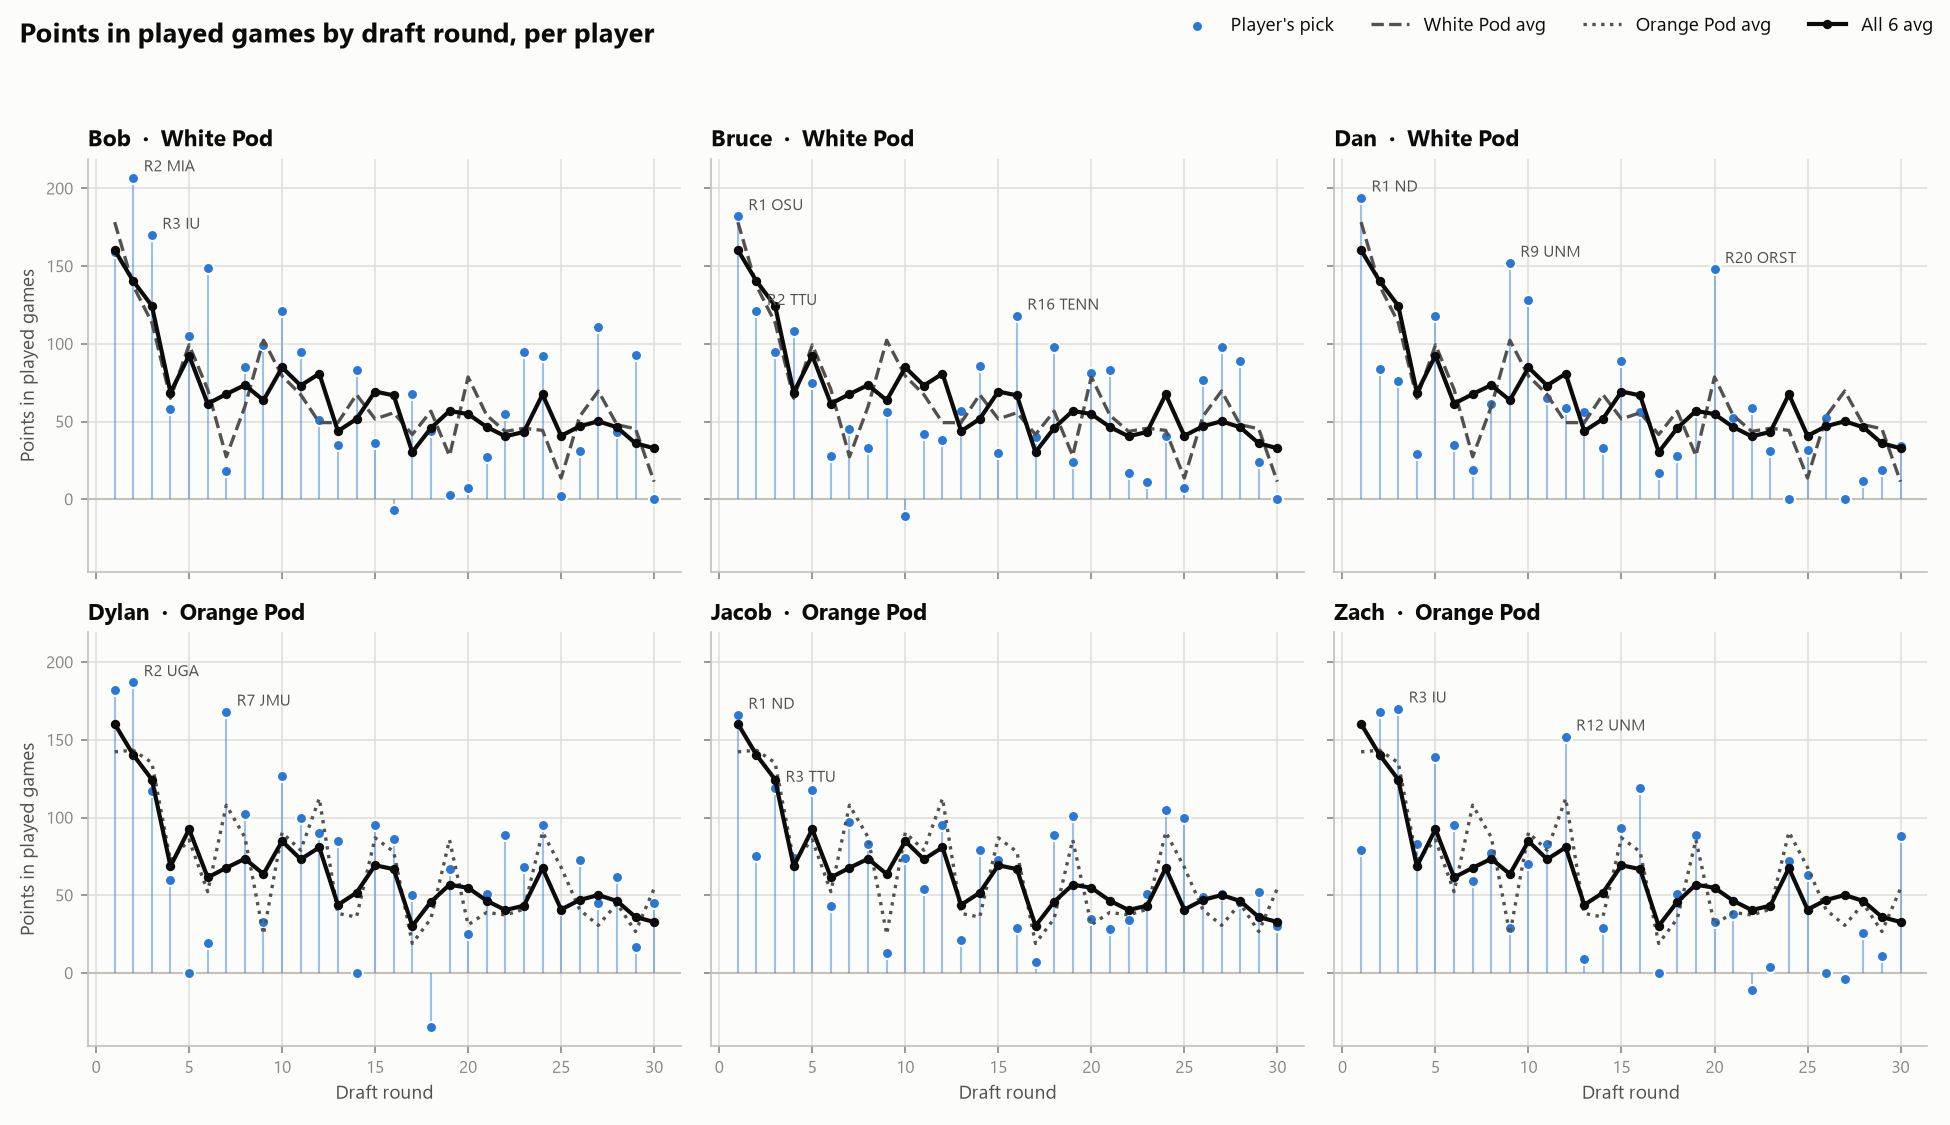
Here is the same data broken up by player, with your pod and the overall trendlines matched up. A lot of this is just noise that can be thrown off by one outlier. As a pity-party example, I’ll point out that everybody but 1 player is way above the average for their first pick, because Oregon has been that bad. But if you want to see where your standouts are, you can compare this to your own notes or the draft recap to see which teams were your smart picks.
We can also look at the share of where our points come from, broken up by draft spot and free agency.
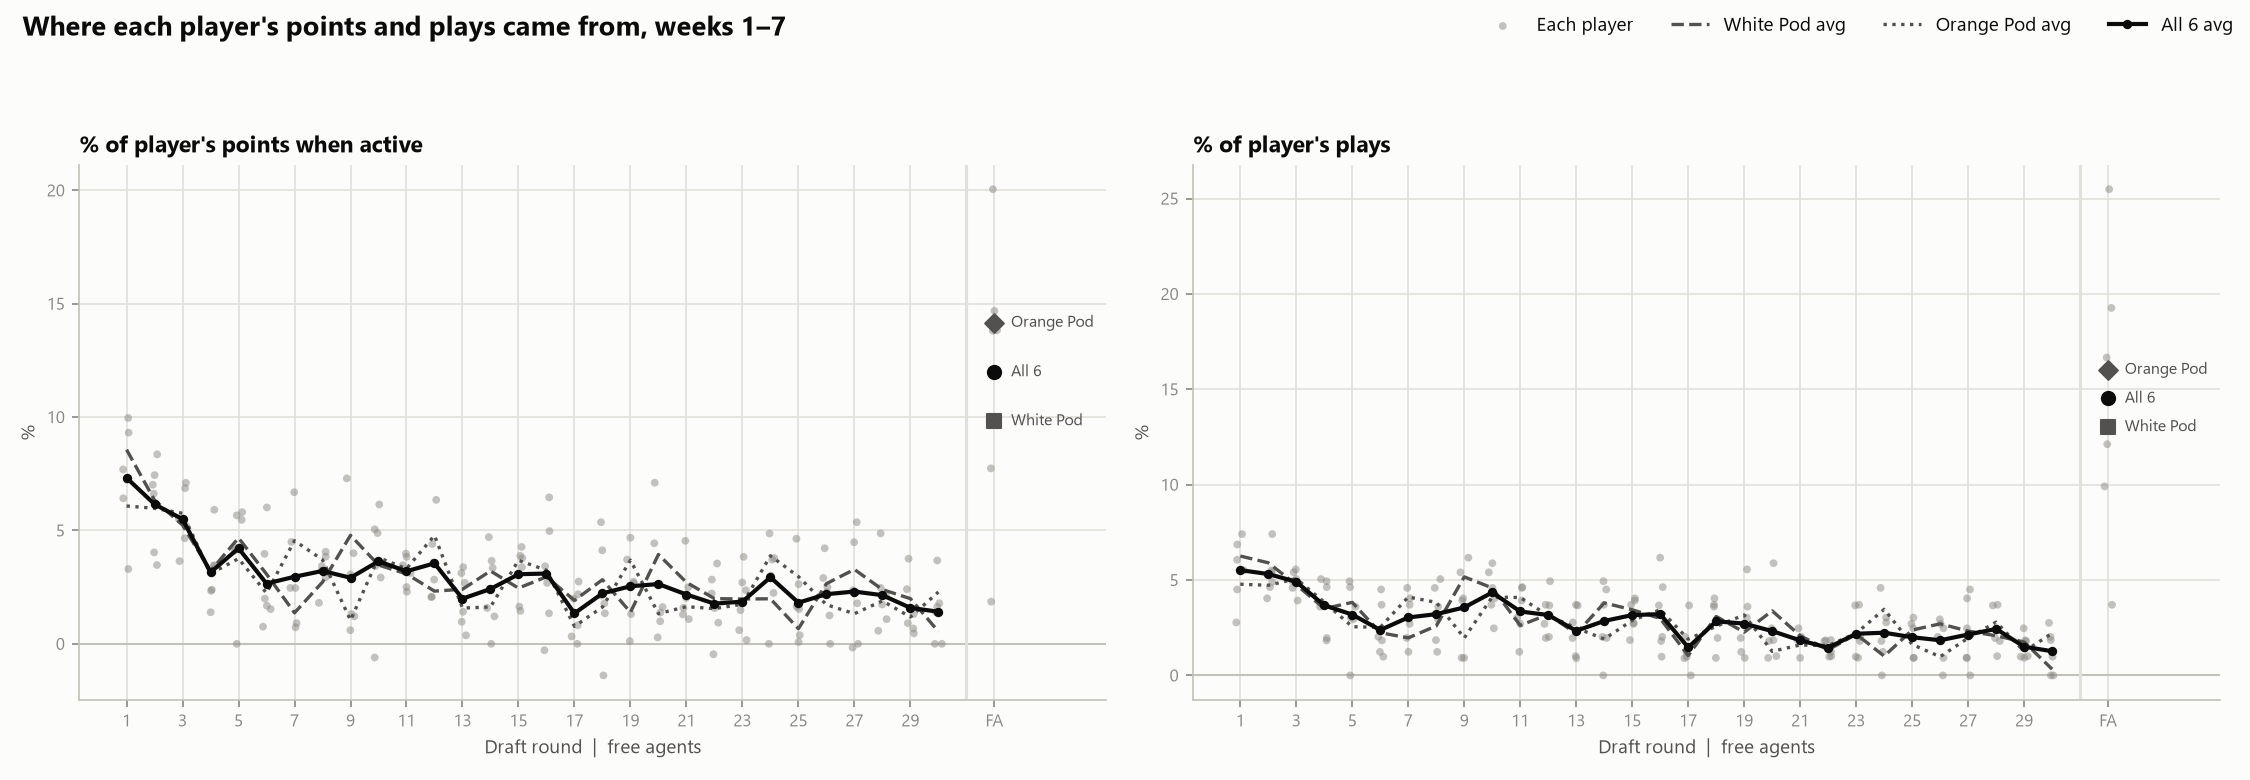
This line is a lot smoother, because an individual team can only make up 1/16th of your weekly lineup plays and usually no more than ~20-30% of your weekly points. But it emphasizes the importance of good FA moves, which are worth a lot of points.
The graph below displays similar information in a different format.
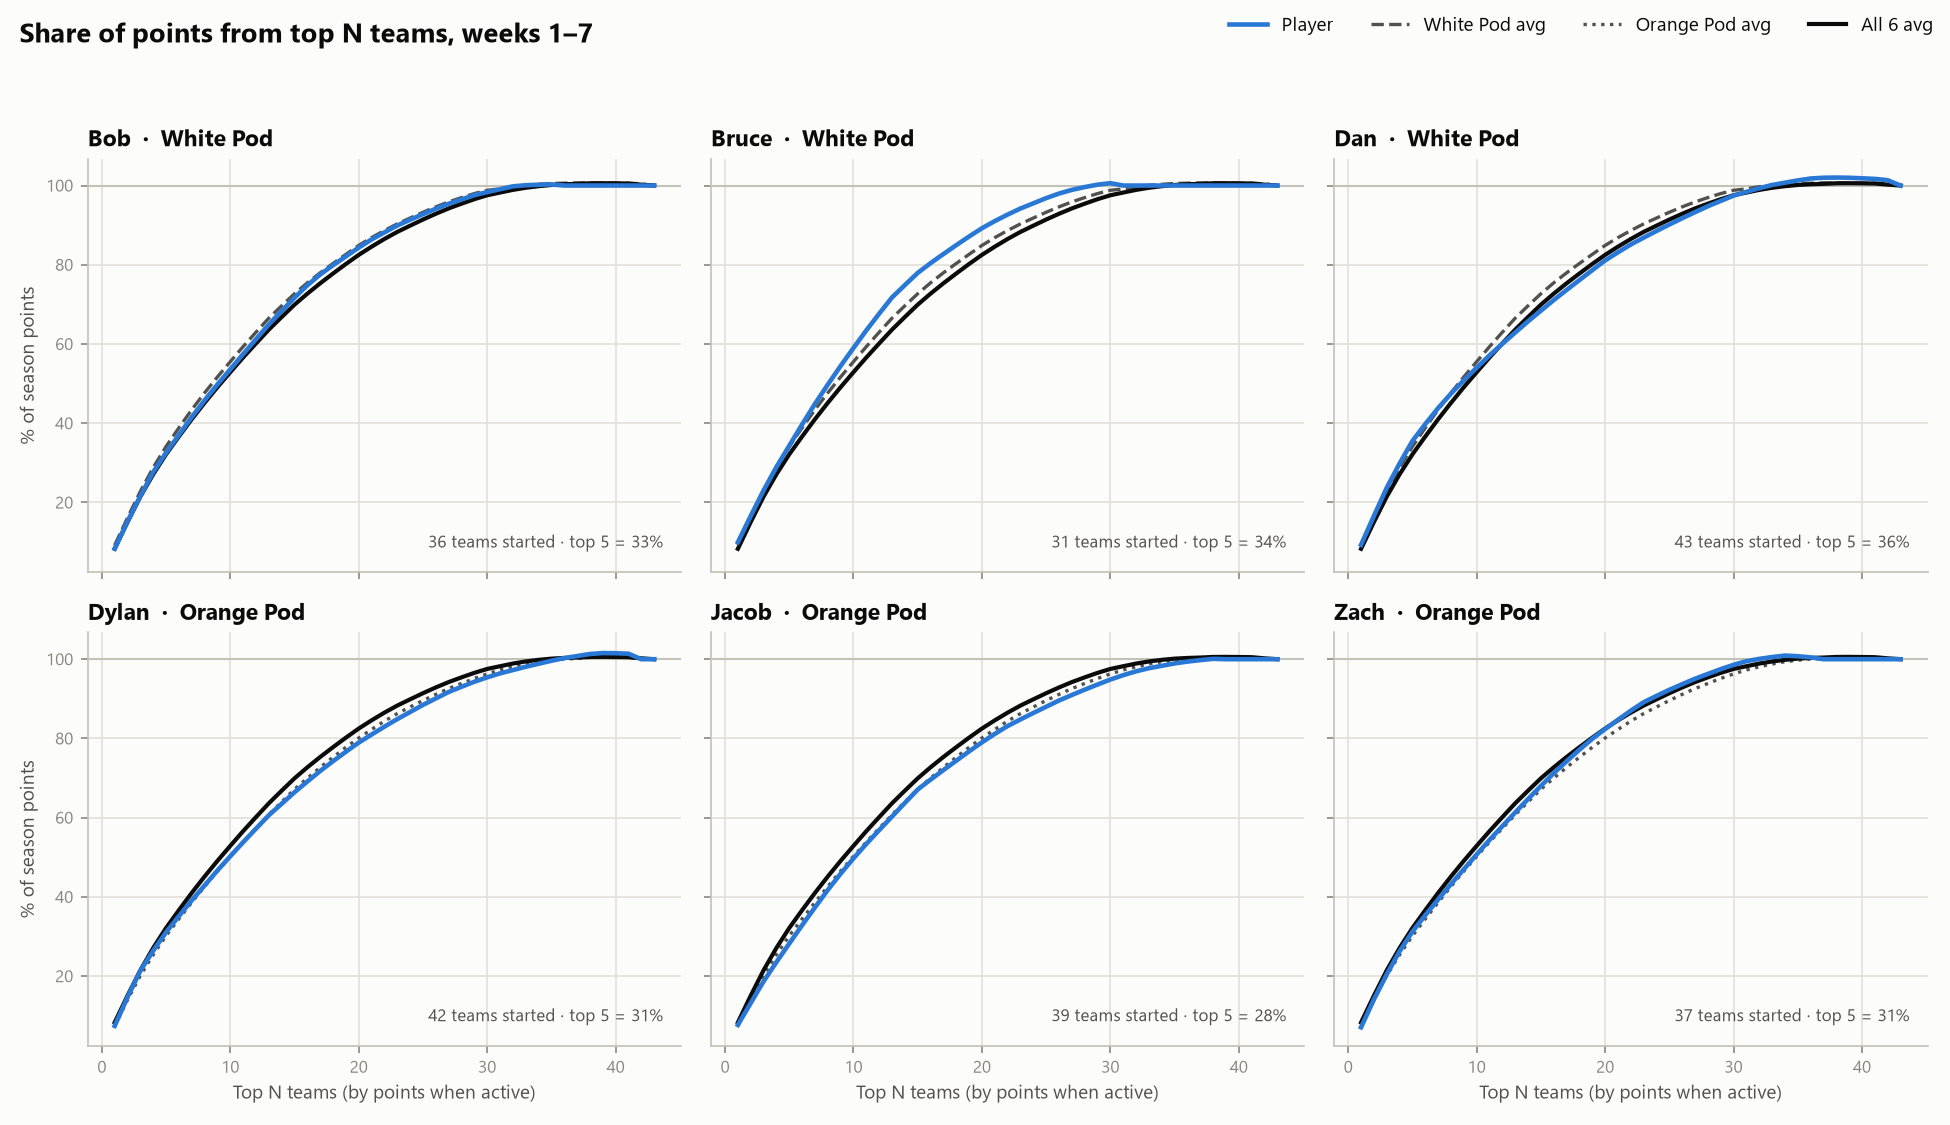
This is a representation of what share of your points you got from your top n most productive teams (i.e., far left is what percentage came from your single highest overall scorer and far right is 100% from all your teams). The steeper the graph, the more you’re reliant on a few heavy hitters, and the smoother and flatter the graph, the more spread out your points are across greater depth. Above the 100 line is the danger zone – these are teams that are, on net, a drain.
Performances by Team and Spot
Here we can see the performances for each player’s average scorecard (P4 flexes and G6 flexes have been summed). I don’t think there are many conclusions that can be drawn here, but it’s a helpful overview of what our rosters look like and where our points come from.
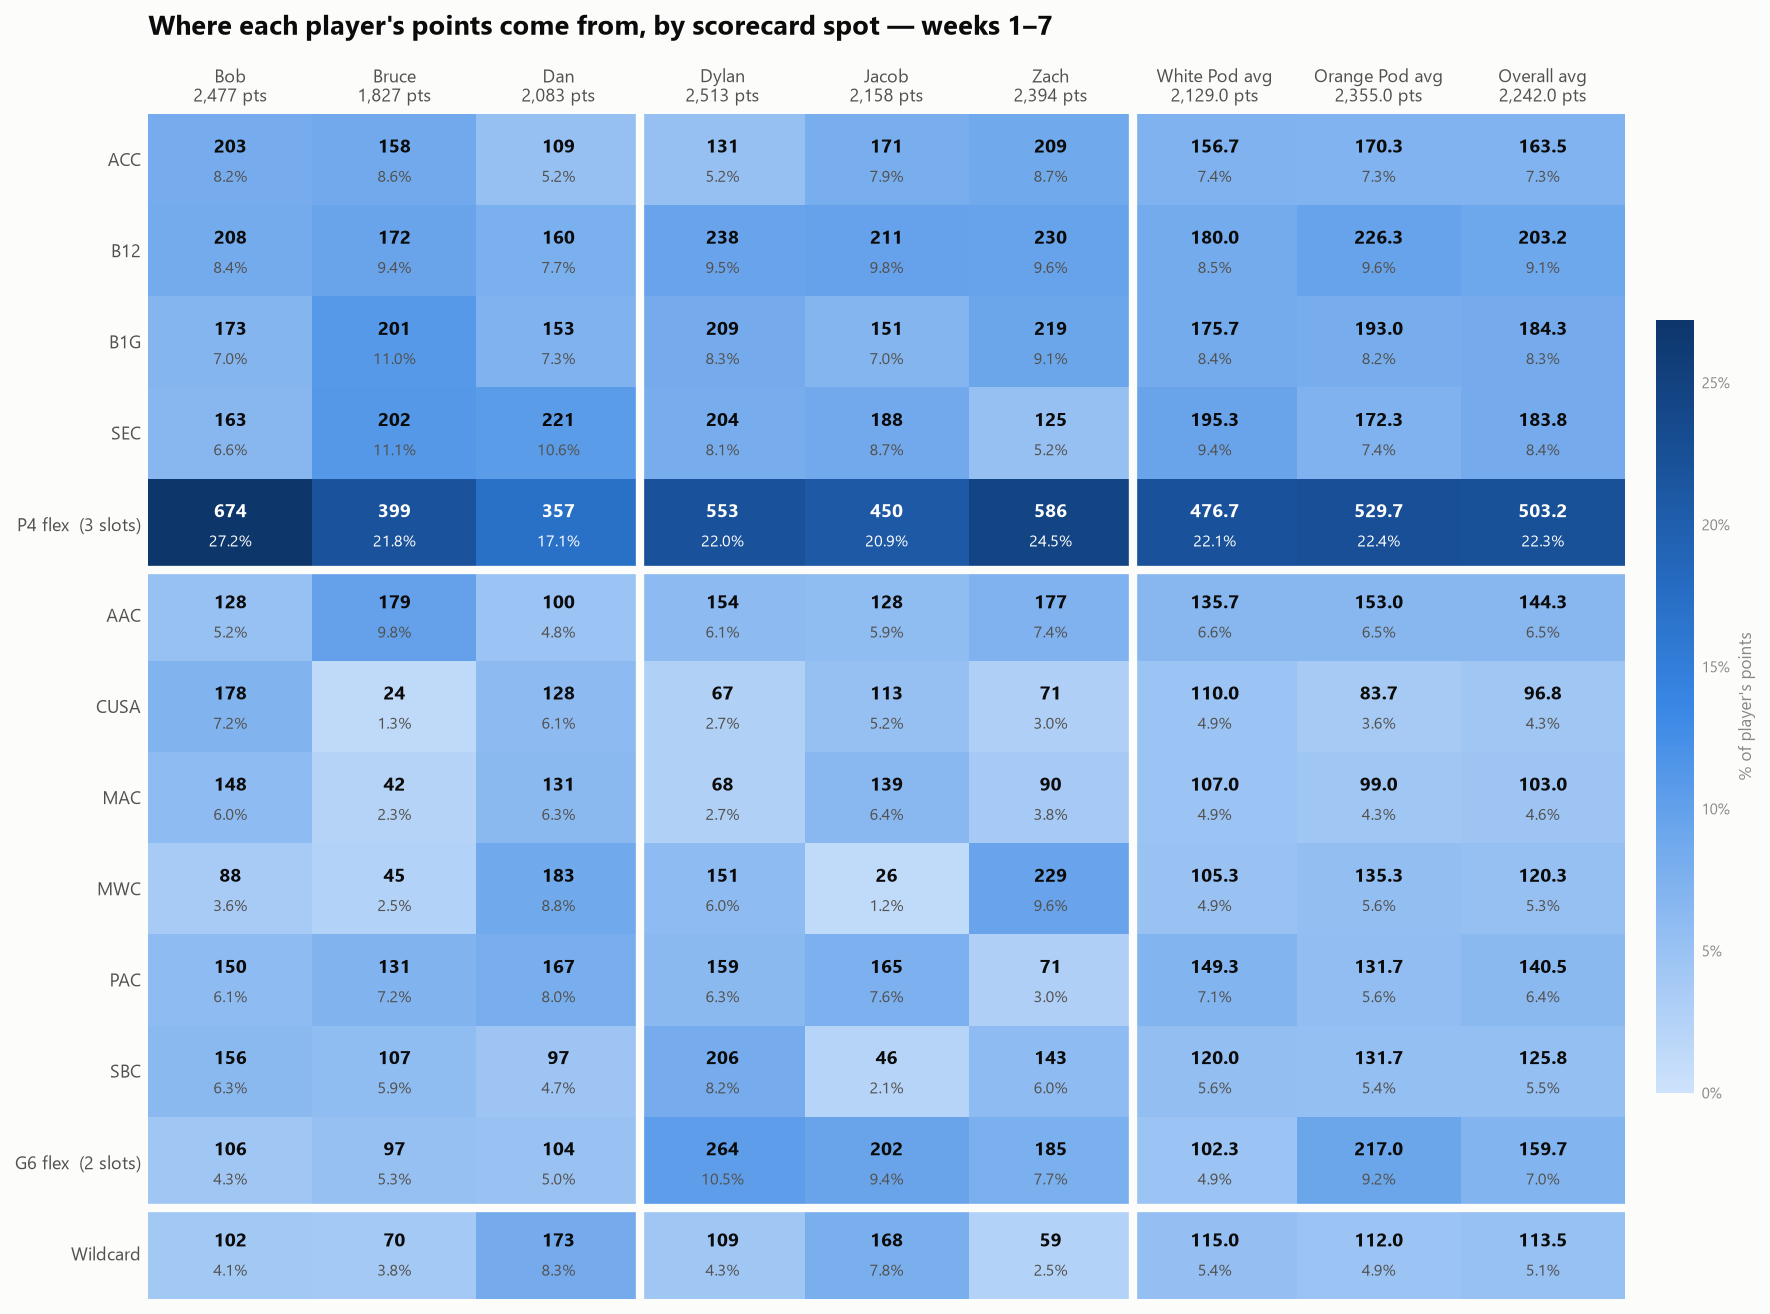
Performances by player
For overall performances, the graphs and data don’t show much that the standings table doesn’t. Bob and Dylan are leading in both pod wins and overall wins, with the rest of us trailing.
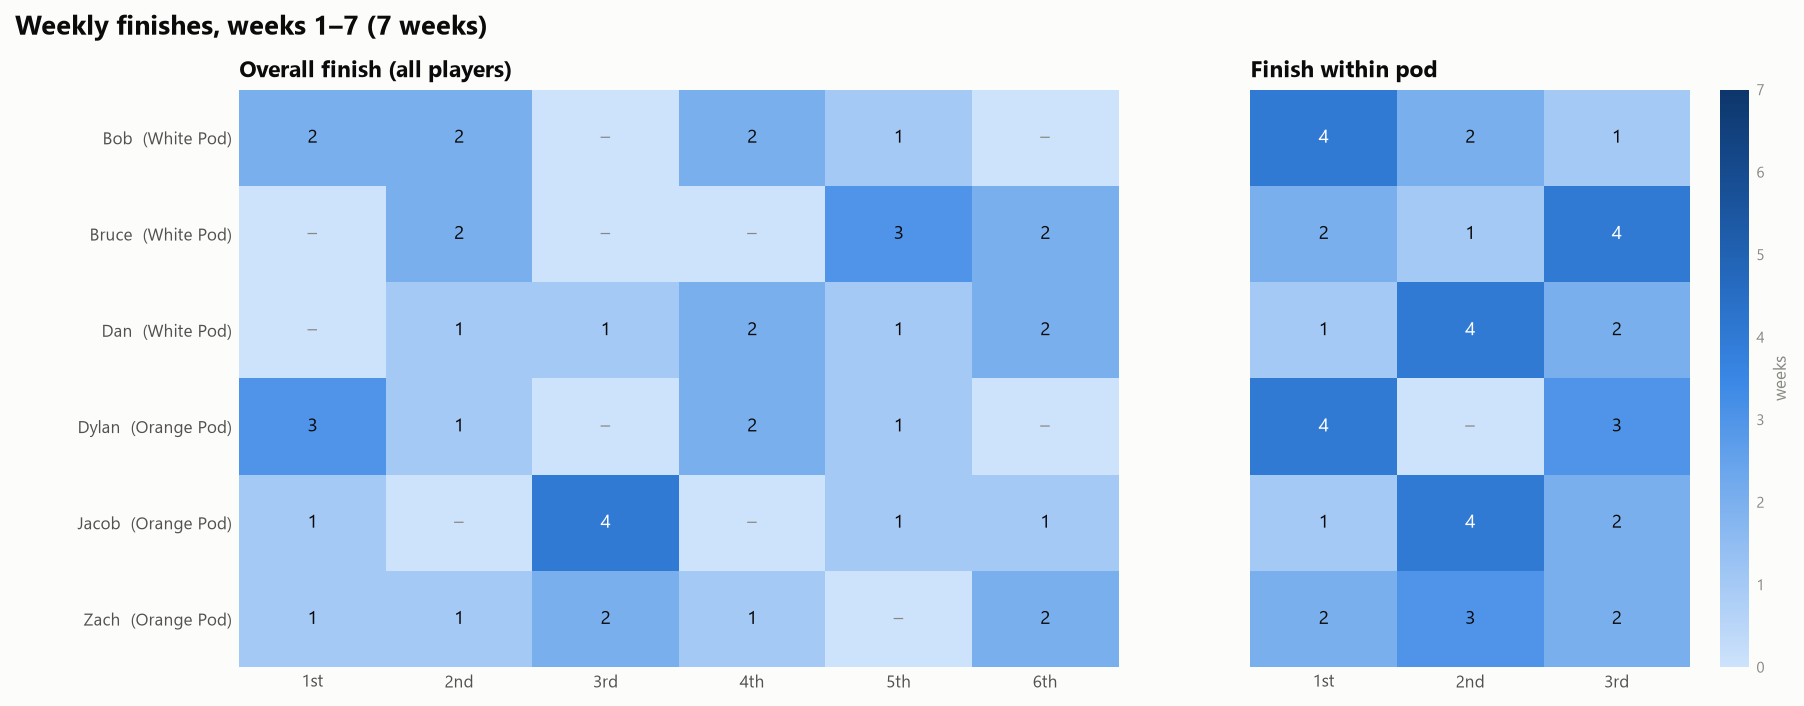
The only interesting things here are that Dylan has never finished 2nd in the Orange pod, with only 4 wins and 3 last-place finishes, and that Jacob, despite a 2-5 PVP record, has finished 3rd overall more times than any other player has finished in any other overall spot.
PVP Standings and Scenarios
Finally, a look ahead at the last 3 weeks of PVP for the “playoff” seeding. As a reminder, the pod winners get a bye, not the top 2 overall, so the White pod is still a heated battle for a bye spot, and with the whole pod currently sitting at 3-4, everybody has a shot at it. When accounting for past performance, Bob builds an edge over the pod and is nearly the odds-on favorite to win the pod at 48%. Because Dylan and I are tied and 2 games ahead of the next cluster, the #1 overall spot is essentially guaranteed to go to our pod, but that might not be beneficial. Because Jacob has one of the most disproportionately bad records, he is the most likely to finish last, but he could also be one of the most likely lower seeds to upset a higher seed. Below are the odds of each player to finish in each spot; “equal odds” assumes each game is 50/50, and “form-weighted” takes everyone pairwise and weights the odds based on their average A vs B scores (i.e., in what percentage of the previous weeks of the season you would have beaten this week’s opponent).
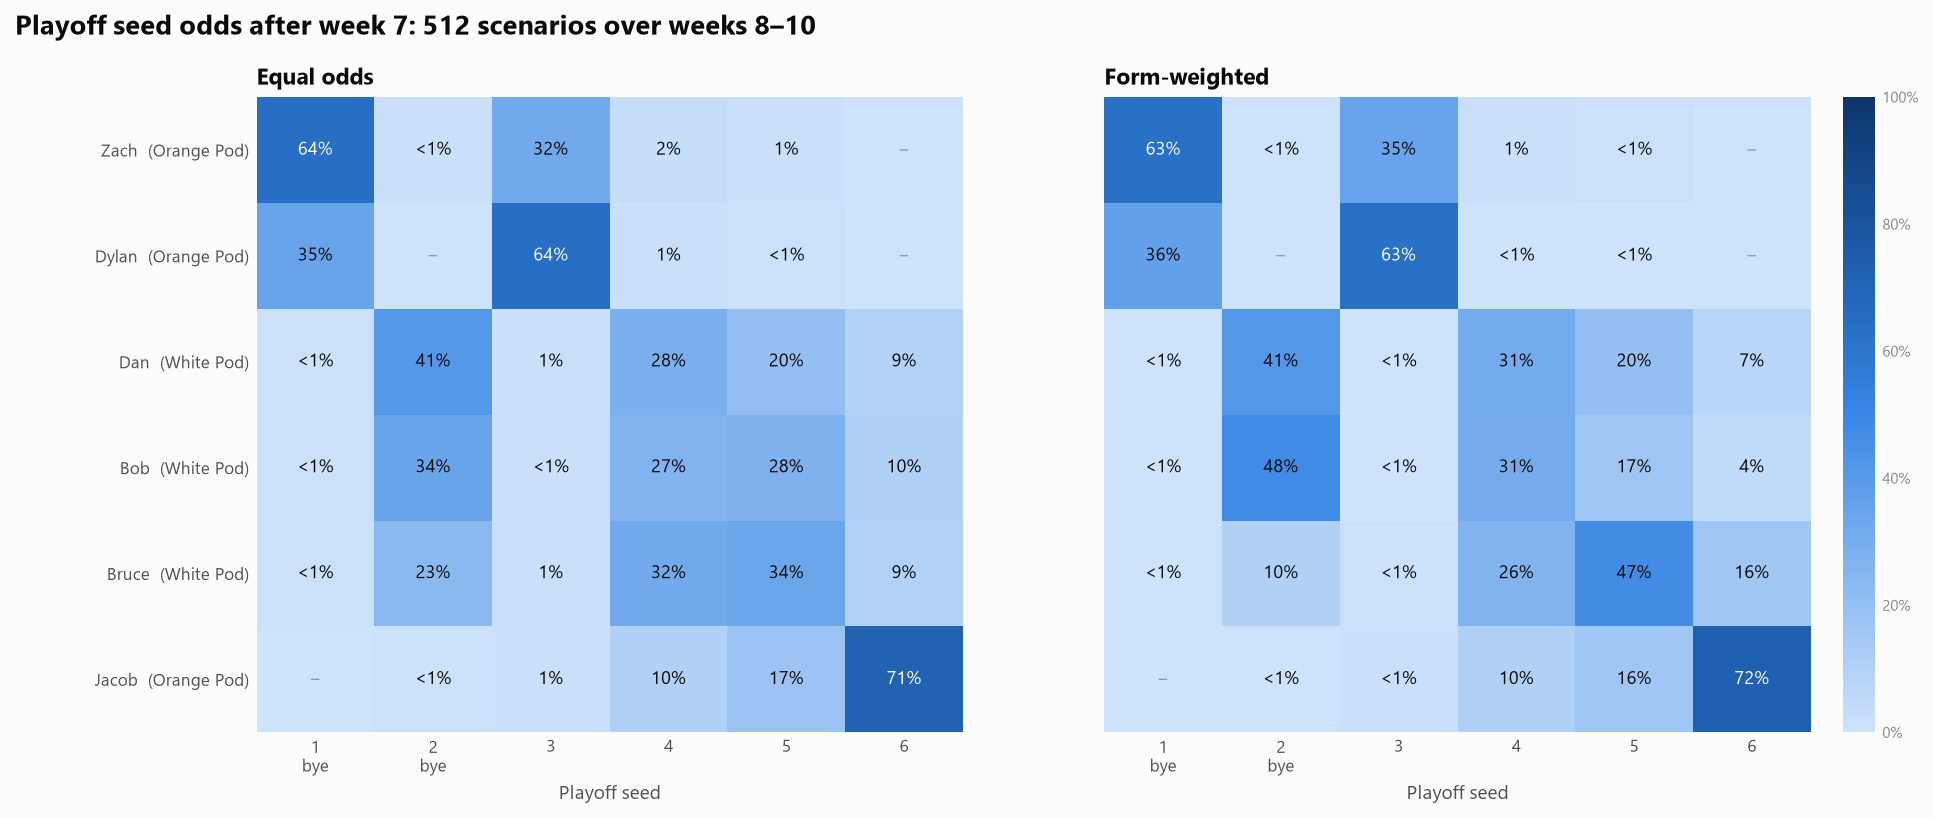
I’ve also added a remaining games simulator to the app where you make your picks, if you want to mock out some scenarios and see where you stand.
The supplementary information for this week, including the rest of the charts from this analysis and an explanation of each, can be found on the 2026 Week 7 Supplementary Information page.
Pod vs. Pod —
Overall Results
This Week’s Matchups
| Player | Pts | Pts | Player |
|---|
Season Leaderboard
| Rk | Player | Match Pts | Total Pts | PVP Record |
|---|
Player Detail
Max — Best Possible Lineup, Any FBS Team
Unplayed Games
Redundant — scored on the bench, but no slot could use them
| Team | Conf | Net | Owner | Pod |
|---|
Wasted — a bench team that could have been swapped in
| Team | Conf | Pts Gained | Instead Of | Owner | Pod |
|---|
Top Unowned Scores (League-Wide)
| Team | Conf | Net | Free Agent In |
|---|
Games by Pod & Ownership
Pick Similarity
Cross-Pod — Same Teams Picked
Which teams two players both picked this week, regardless of the slot each used. Same-pod players can’t share a team.
Ranked by matching teams
| Pair | Matching | Shared Impact | Shared Teams |
|---|
Ranked by shared impact (Σ |margin|)
| Pair | Shared Impact | Matching | Shared Teams |
|---|
Every Pair — Points Per Slot
Slot for slot, how close were the points? Conference slots pair by conference; the flex slots pair best-to-best by margin. Lower distance = more alike. Same-direction slots are where both picks won, both lost, or both hit zero.
| Pair | Slot Pt Distance | Same-Direction Slots |
|---|